Kit Carson County is a Republican stronghold. About 18% of voters here vote Democratic and 82% Republican.
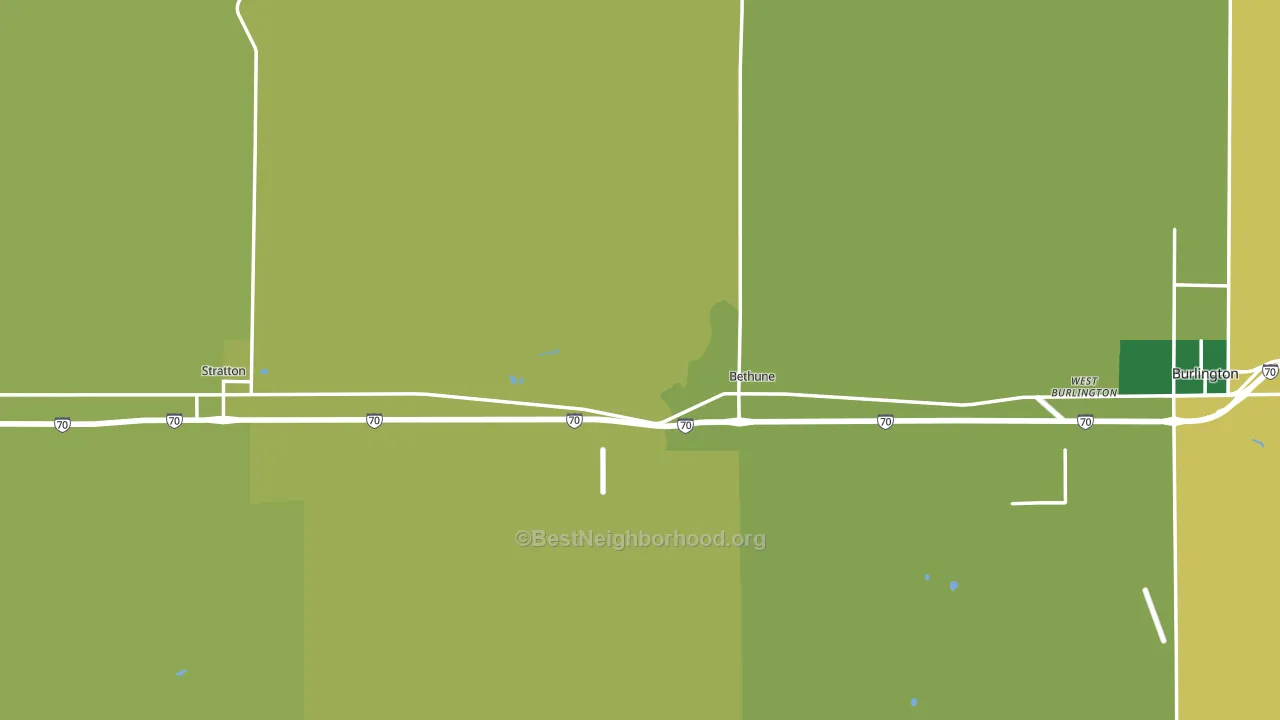
About 81% of adults in Kit Carson County typically vote, above the U.S. average of about 62%. Among adults in Kit Carson County, ~15% vote Democratic, ~66% Republican, and ~19% don't vote. The map below shows estimated turnout by block group.
How Kit Carson County compares
Among counties within 50 miles, Kit Carson County is the least Republican-leaning.
Kit Carson County runs about 75 points more Republican than Colorado as a whole. Colorado leans Democratic overall, while Kit Carson County is one of the few Republican-leaning pockets.
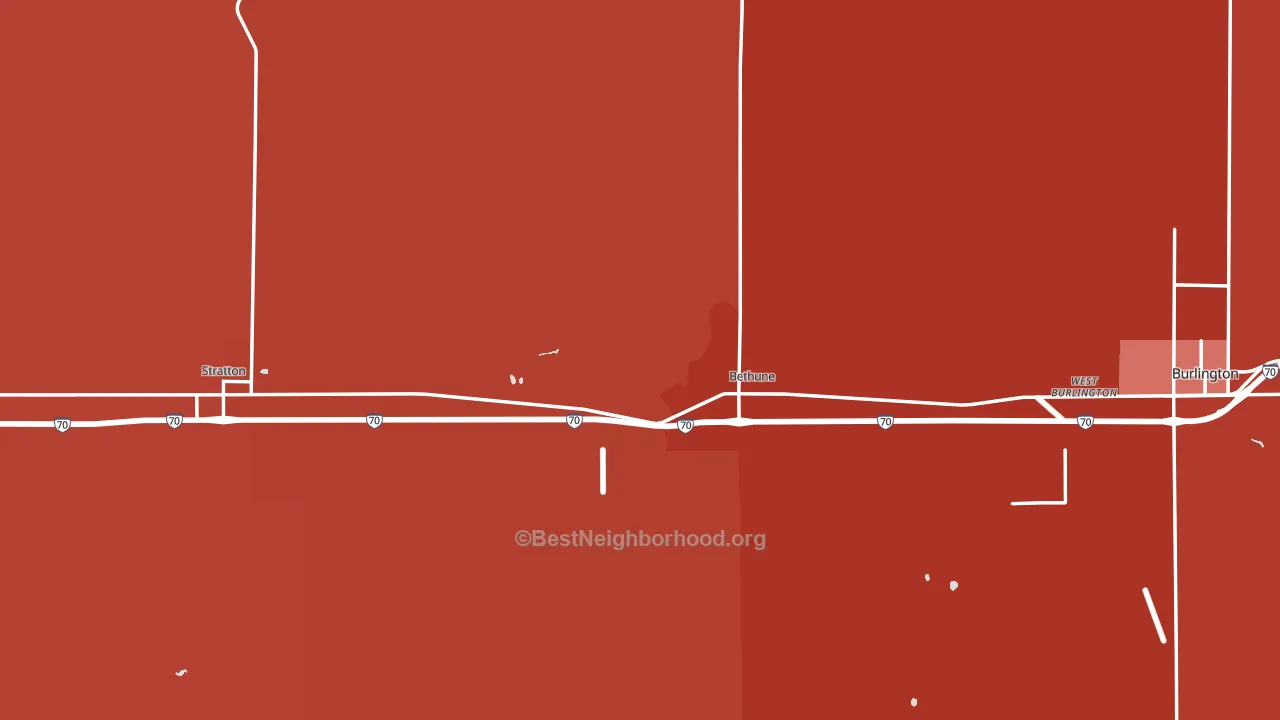
Politics vary noticeably by city within Kit Carson County. The southwest side is the most Republican-leaning (R+72) and the east side is the least Republican-leaning (R+56), a spread of about 16 points.
Why Kit Carson County leans the way it does
This analysis examined 14,881 data points per county to find what predicts political lean and turnout. The items below are a few correlations that stood out for Kit Carson County, not a ranked or complete list of what matters most.
Kit Carson County votes against the grain of Colorado. Colorado leans Democratic overall, while Kit Carson County runs about 75 points more Republican.
Never-married share and voter turnout
Places with a low never-married share tend to turn out at a higher rate; Kit Carson County, CO sits in the bottom tenth nationally on this measure.
Why turnout in Kit Carson County looks the way it does
Turnout in Kit Carson County sits close to the national pattern. Routine healthcare access, homeownership, education, and food security all land near their national averages here. Learn more about the findings and methodology on the political spectrum map.
Nearby Counties
- Cheyenne County, CO R+72
- Sherman County, KS R+66
- Wallace County, KS R+83
- Cheyenne County, KS R+71
- Yuma County, CO R+60
- Kiowa County, CO R+72
- Lincoln County, CO R+61
- Washington County, CO R+70
- Greeley County, KS R+68
- Dundy County, NE R+67
Counties with Similar Populations
- Union County, IN R+58
- Pocahontas County, IA R+48
- Brooks County, TX D+7
- Nemaha County, NE R+45
- Beaver County, UT R+69
- Dallam County, TX R+46
- Blaine County, MT Even
- Shannon County, MO R+68
- Caribou County, ID R+73
- Goliad County, TX R+60
Sources and methodology
Precinct-level voting records used to fit the model come from Colorado Secretary of State, Elections, distributed by the Voting and Election Science Team. Demographic inputs come from the U.S. Census Bureau (ACS 5-year estimates and the 2020 Decennial Census). Health and environmental inputs come from the CDC (PLACES and the Environmental Justice Index). Land cover comes from the USGS and EPA. Election-day and lead-up weather come from PRISM 4km daily grids and the NOAA Global Historical Climatology Network. Mail-voting and election-administration patterns come from the MIT Election Lab's Survey of the Performance of American Elections. Block-group crime detail comes from CrimeGrade. Internet data and modeling support provided by ISPreports.org.
Modeling and analysis by the BestNeighborhood data science team. Full methodology and findings: political spectrum map.
Methodology reviewed by the BestNeighborhood data team. Last updated May 2026.