Goliad County is a Republican stronghold. About 20% of voters here vote Democratic and 80% Republican.
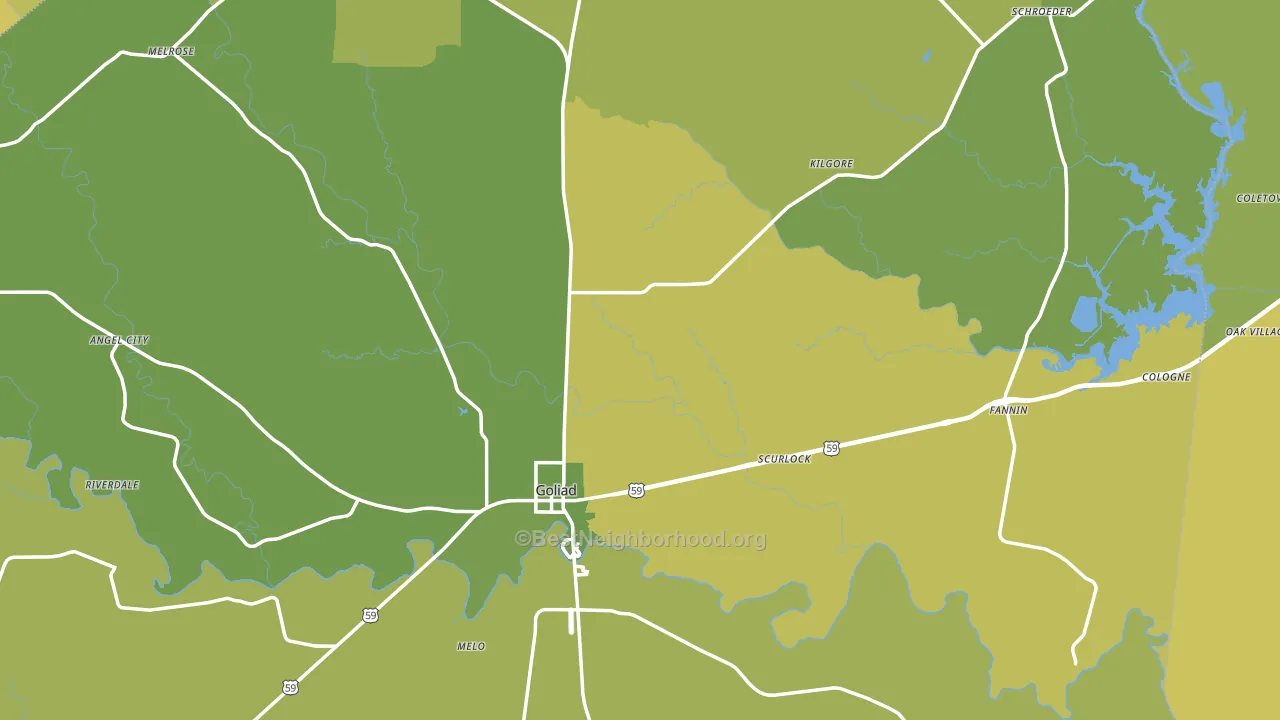
About 70% of adults in Goliad County typically vote, above the U.S. average of about 62%. Among adults in Goliad County, ~14% vote Democratic, ~56% Republican, and ~30% don't vote. The map below shows estimated turnout by block group.
How Goliad County compares
Among counties within 50 miles, Goliad County leans more Republican than 6 of 7 neighbors.
Goliad County runs about 46 points more Republican than Texas as a whole.
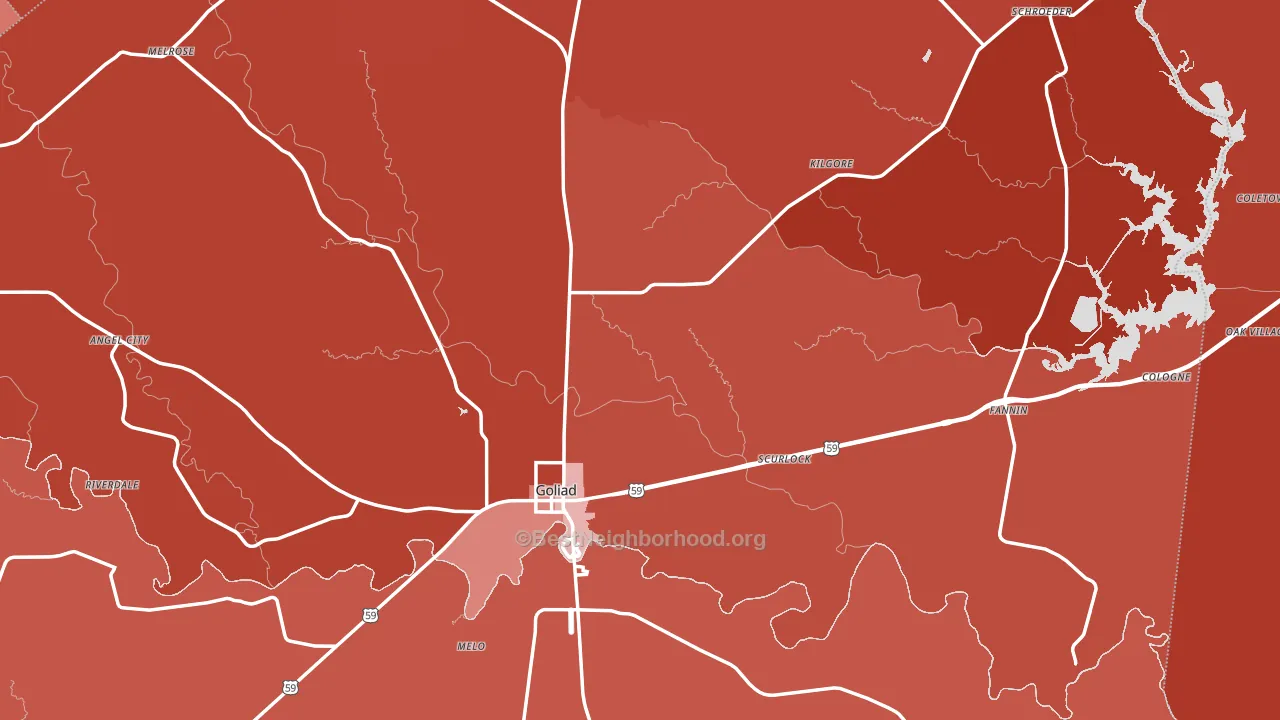
Politics vary noticeably by city within Goliad County. The northeast side is the most Republican-leaning (R+72) and the south side is the least Republican-leaning (R+33), a spread of about 39 points.
Why Goliad County leans the way it does
This analysis examined 14,881 data points per county to find what predicts political lean and turnout. The items below are a few correlations that stood out for Goliad County, not a ranked or complete list of what matters most.
Rural areas vote Republican. About 11% of residents in Goliad County live in densely developed areas, about 23 points below the Texas average of 35%.
Paved land cover and Republican lean
Places with little paved surface tend to lean Republican; Goliad County, TX sits in the bottom quarter nationally on this measure. Paved ground does not change how people vote; it mostly reflects how urban and built-up a place is.
Why turnout in Goliad County looks the way it does
Homeowners vote more often than renters. About 87% of households in Goliad County own their home, about 12 points above the Texas average of 75%. Limited routine healthcare access lines up with lower turnout, and Goliad County sits in the bottom quarter on routine-care measures. Learn more about the findings and methodology on the political spectrum map.
Nearby Counties
- Victoria County, TX R+28
- DeWitt County, TX R+49
- Refugio County, TX R+36
- Bee County, TX R+22
- Karnes County, TX R+35
- Calhoun County, TX R+37
- Jackson County, TX R+62
- Aransas County, TX R+46
- Lavaca County, TX R+64
- Live Oak County, TX R+61
Counties with Similar Populations
- Ida County, IA R+57
- Lake County, TN R+37
- Bon Homme County, SD R+58
- Caribou County, ID R+73
- Shannon County, MO R+68
- Blaine County, MT Even
- Forest County, PA R+24
- Fall River County, SD R+52
- Swisher County, TX R+48
- Tillman County, OK R+55
Sources and methodology
Precinct-level voting records used to fit the model come from Texas Secretary of State, Elections Division, distributed by the Voting and Election Science Team. Demographic inputs come from the U.S. Census Bureau (ACS 5-year estimates and the 2020 Decennial Census). Health and environmental inputs come from the CDC (PLACES and the Environmental Justice Index). Land cover comes from the USGS and EPA. Election-day and lead-up weather come from PRISM 4km daily grids and the NOAA Global Historical Climatology Network. Mail-voting and election-administration patterns come from the MIT Election Lab's Survey of the Performance of American Elections. Block-group crime detail comes from CrimeGrade. Internet data and modeling support provided by ISPreports.org.
Modeling and analysis by the BestNeighborhood data science team. Full methodology and findings: political spectrum map.
Methodology reviewed by the BestNeighborhood data team. Last updated May 2026.