Lake County leans Democratic by roughly 24 points: about 62% of voters vote Democratic and 38% Republican.
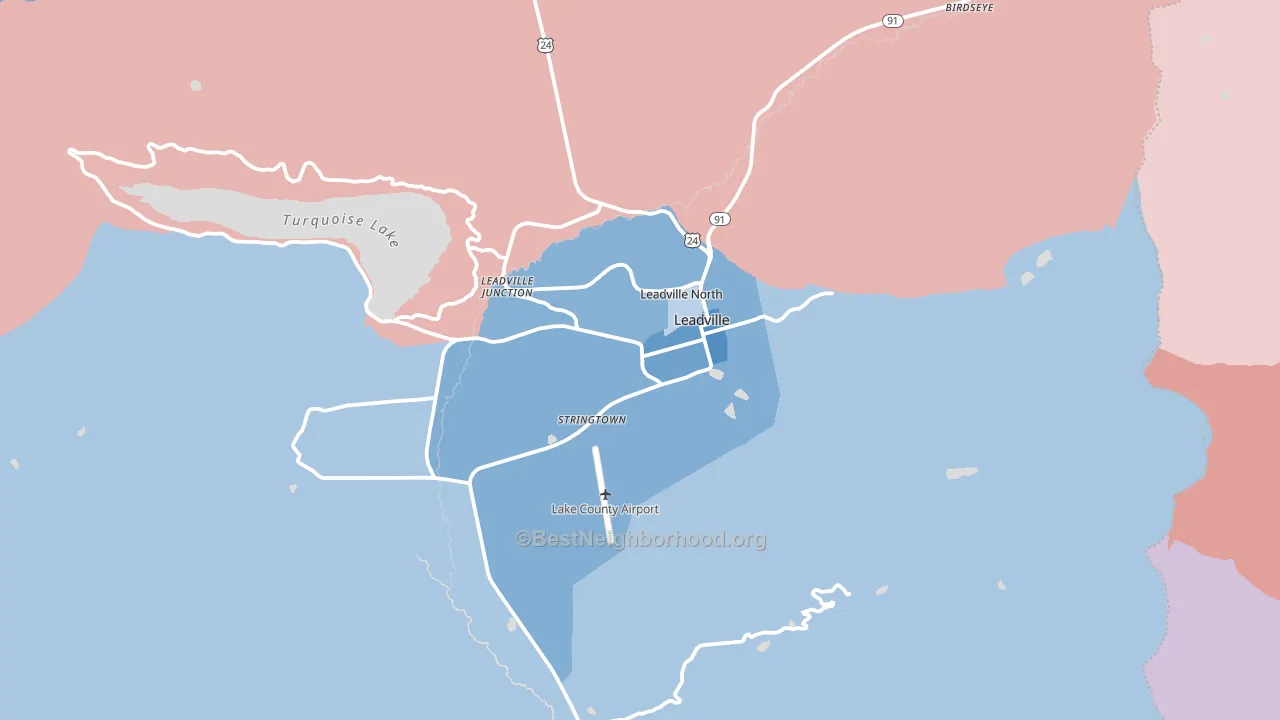
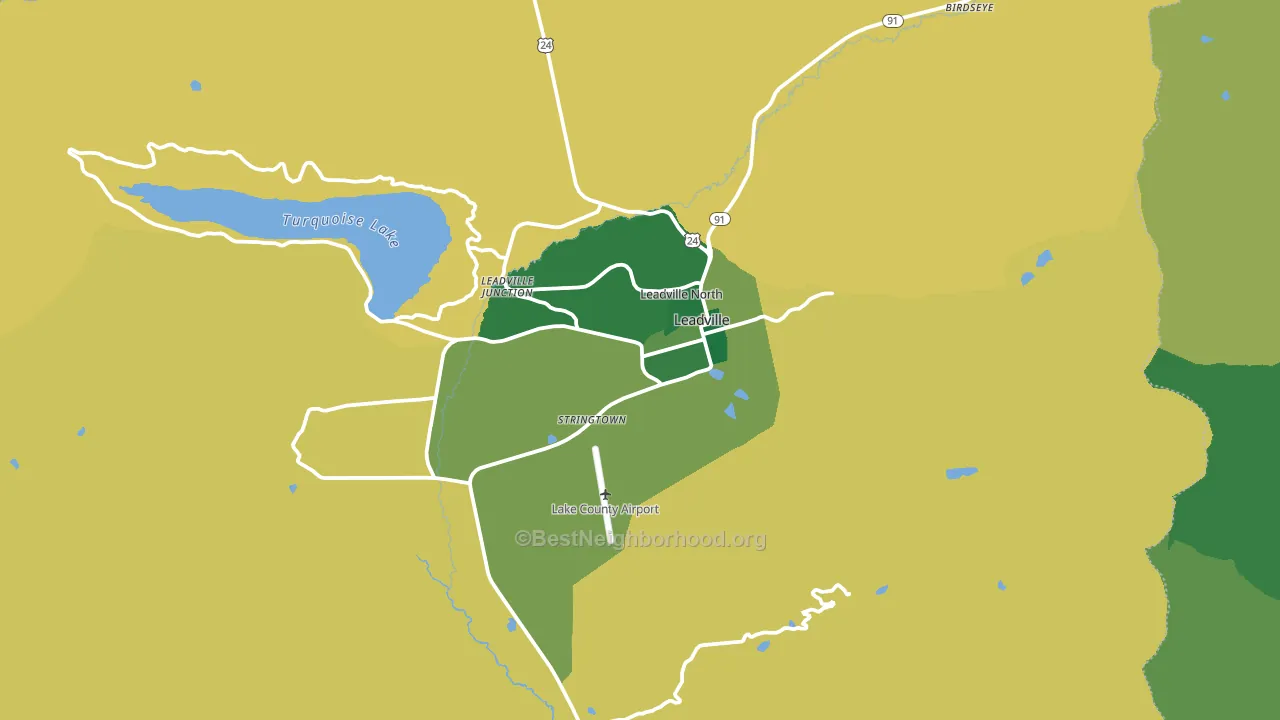
About 90% of adults in Lake County typically vote, above the U.S. average of about 62%. Among adults in Lake County, ~56% vote Democratic, ~34% Republican, and ~10% don't vote. The map below shows estimated turnout by block group.
How Lake County compares
Among counties within 50 miles, Lake County leans more Democratic than 4 of 5 neighbors.
Lake County runs about 14 points more Democratic than Colorado as a whole.
Politics vary noticeably by city within Lake County. The east side runs the most Democratic (D+36) and the southeast side runs the most Republican (R+4), a spread of about 40 points.
Why Lake County leans the way it does
This analysis examined 14,881 data points per county to find what predicts political lean and turnout. The items below are a few correlations that stood out for Lake County, not a ranked or complete list of what matters most.
Areas with high college attainment vote Democratic. About 48% of adults in Lake County hold a bachelor's degree, about 20 points above the U.S. average of 28%.
Paved land cover and Democratic lean
Places with extensive paved surfaces tend to lean Democratic; Lake County, CO sits in the top quarter nationally on this measure. Paved ground does not change how people vote; it mostly reflects how urban and built-up a place is.
Why turnout in Lake County looks the way it does
Areas with high high-school completion turn out at higher rates. About 94% of adults in Lake County have completed high school, above 81% of counties. Learn more about the findings and methodology on the political spectrum map.
Nearby Counties
- Summit County, CO D+23
- Pitkin County, CO D+40
- Eagle County, CO D+14
- Park County, CO R+9
- Chaffee County, CO D+6
- Clear Creek County, CO D+21
- Gunnison County, CO D+31
- Grand County, CO R+6
- Gilpin County, CO D+16
- Teller County, CO R+23
Counties with Similar Populations
- Worth County, IA R+37
- Hutchinson County, SD R+65
- East Carroll Parish, LA D+18
- Conejos County, CO R+25
- Chariton County, MO R+61
- Gilmer County, WV R+40
- Kingman County, KS R+58
- Wheeler County, GA R+31
- Lee County, KY R+67
- Wallowa County, OR R+20
Sources and methodology
Precinct-level voting records used to fit the model come from Colorado Secretary of State, Elections, distributed by the Voting and Election Science Team. Demographic inputs come from the U.S. Census Bureau (ACS 5-year estimates and the 2020 Decennial Census). Health and environmental inputs come from the CDC (PLACES and the Environmental Justice Index). Land cover comes from the USGS and EPA. Election-day and lead-up weather come from PRISM 4km daily grids and the NOAA Global Historical Climatology Network. Mail-voting and election-administration patterns come from the MIT Election Lab's Survey of the Performance of American Elections. Block-group crime detail comes from CrimeGrade. Internet data and modeling support provided by ISPreports.org.
Modeling and analysis by the BestNeighborhood data science team. Full methodology and findings: political spectrum map.
Methodology reviewed by the BestNeighborhood data team. Last updated May 2026.