Park County leans slightly Republican by roughly 10 points: about 45% of voters vote Democratic and 55% Republican.
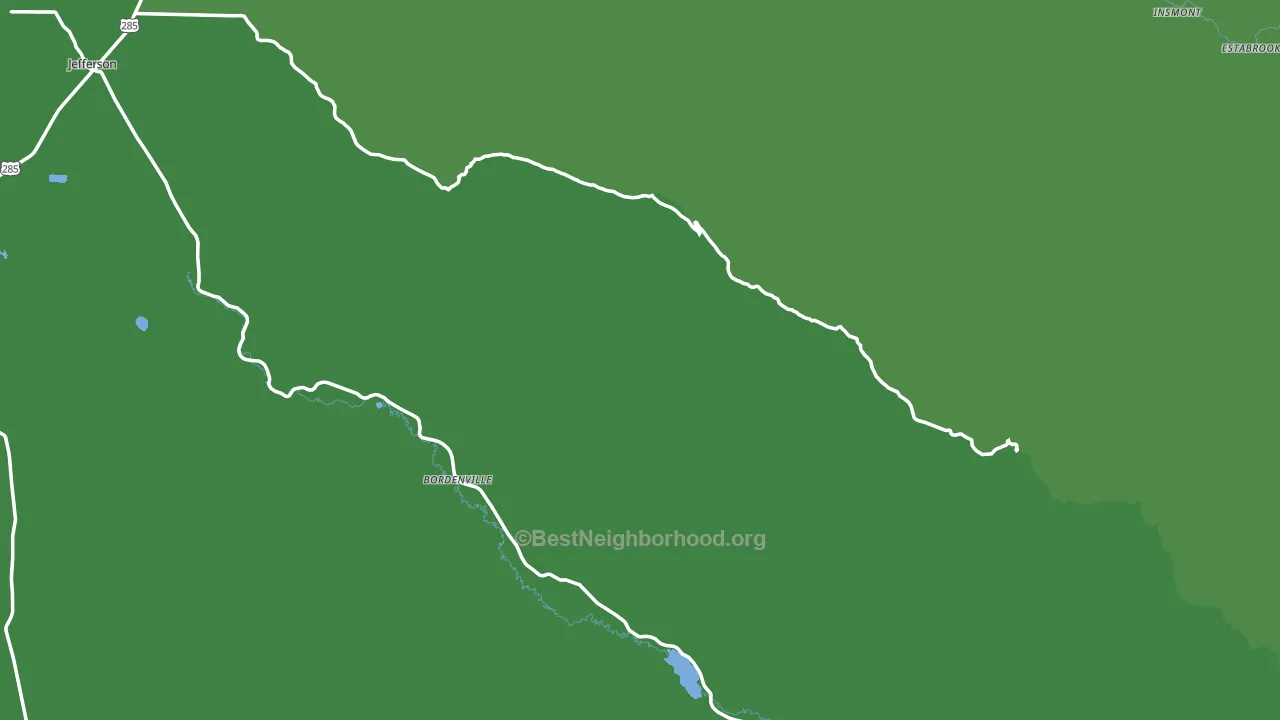
About 87% of adults in Park County typically vote, above the U.S. average of about 62%. Among adults in Park County, ~39% vote Democratic, ~48% Republican, and ~13% don't vote. The map below shows estimated turnout by block group.
How Park County compares
Among counties within 50 miles, Park County leans more Republican than 9 of 10 neighbors.
Park County runs about 20 points more Republican than Colorado as a whole. Colorado leans Democratic overall, while Park County is one of the few Republican-leaning pockets.
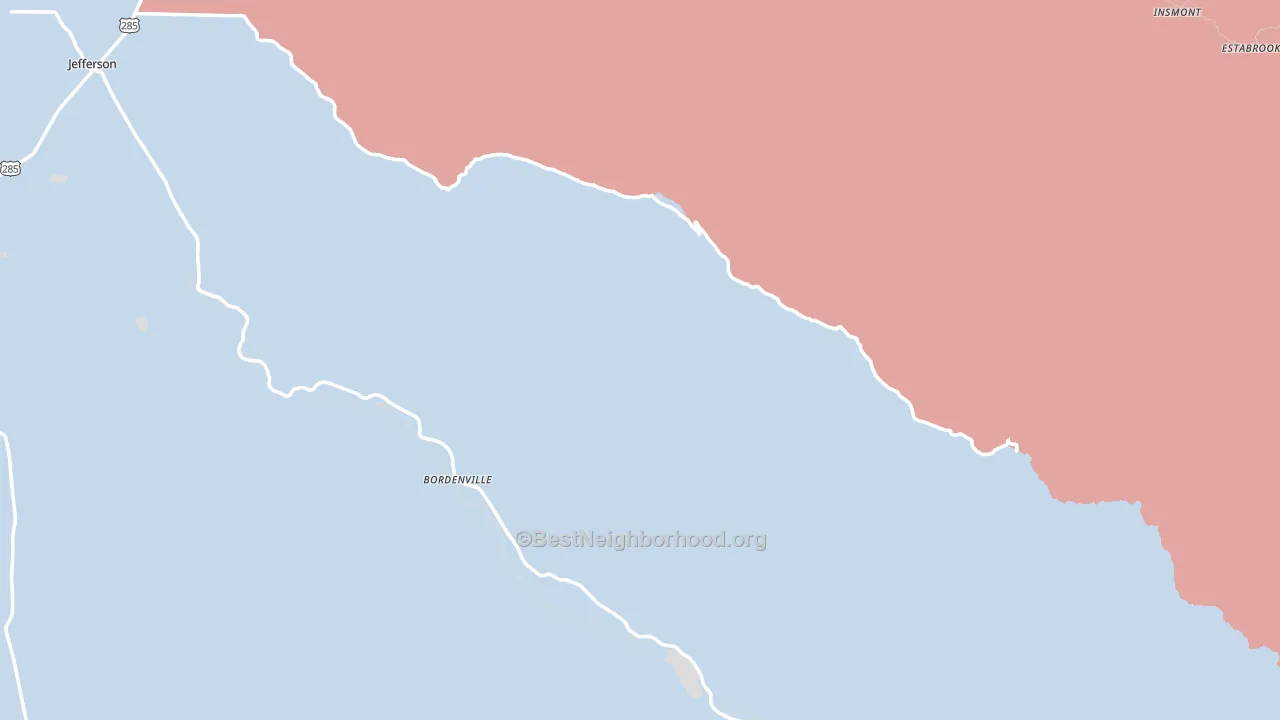
Politics vary noticeably by city within Park County. The northwest side runs the most Democratic (D+8) and the northeast side runs the most Republican (R+15), a spread of about 23 points.
Why Park County leans the way it does
This analysis examined 14,881 data points per county to find what predicts political lean and turnout. The items below are a few correlations that stood out for Park County, not a ranked or complete list of what matters most.
Rural areas vote Republican. About 4% of residents in Park County live in densely developed areas, about 31 points below the Colorado average of 35%. A high family-household share predicts Republican voting, and about 70% of households in Park County are family households, above 81% of counties. Park County runs against the grain of Colorado, a Republican-leaning pocket in a Democratic-leaning state.
Paved land cover and Republican lean
Places with little paved surface tend to lean Republican; Park County, CO sits in the bottom tenth nationally on this measure. Paved ground does not change how people vote; it mostly reflects how urban and built-up a place is.
Why turnout in Park County looks the way it does
Areas with strong routine healthcare access turn out at higher rates. Park County is in the top quarter nationally for routine-care measures such as insurance coverage, preventive screenings, and dental visits. The dental-visit rate here is about 67%, about 7 points above the U.S. average of 60%. Homeowners vote more often than renters, and about 89% of households in Park County own their home, in the top fraction of counties. High high-school completion lines up with higher turnout, and about 98% of adults in Park County have completed high school, in the top fraction of counties. Learn more about the findings and methodology on the political spectrum map.
Nearby Counties
- Clear Creek County, CO D+21
- Summit County, CO D+23
- Teller County, CO R+23
- Lake County, CO D+25
- Gilpin County, CO D+16
- Jefferson County, CO D+18
- Douglas County, CO R+7
- Denver County, CO D+53
- Arapahoe County, CO D+22
- Chaffee County, CO D+6
Counties with Similar Populations
- Pitkin County, CO D+40
- Drew County, AR R+25
- Chester County, TN R+61
- Northampton County, NC D+15
- Richland County, WI R+19
- Lee County, TX R+52
- Delaware County, IA R+39
- Humboldt County, NV R+53
- Sharp County, AR R+62
- Union County, IL R+48
Sources and methodology
Precinct-level voting records used to fit the model come from Colorado Secretary of State, Elections, distributed by the Voting and Election Science Team. Demographic inputs come from the U.S. Census Bureau (ACS 5-year estimates and the 2020 Decennial Census). Health and environmental inputs come from the CDC (PLACES and the Environmental Justice Index). Land cover comes from the USGS and EPA. Election-day and lead-up weather come from PRISM 4km daily grids and the NOAA Global Historical Climatology Network. Mail-voting and election-administration patterns come from the MIT Election Lab's Survey of the Performance of American Elections. Block-group crime detail comes from CrimeGrade. Internet data and modeling support provided by ISPreports.org.
Modeling and analysis by the BestNeighborhood data science team. Full methodology and findings: political spectrum map.
Methodology reviewed by the BestNeighborhood data team. Last updated May 2026.