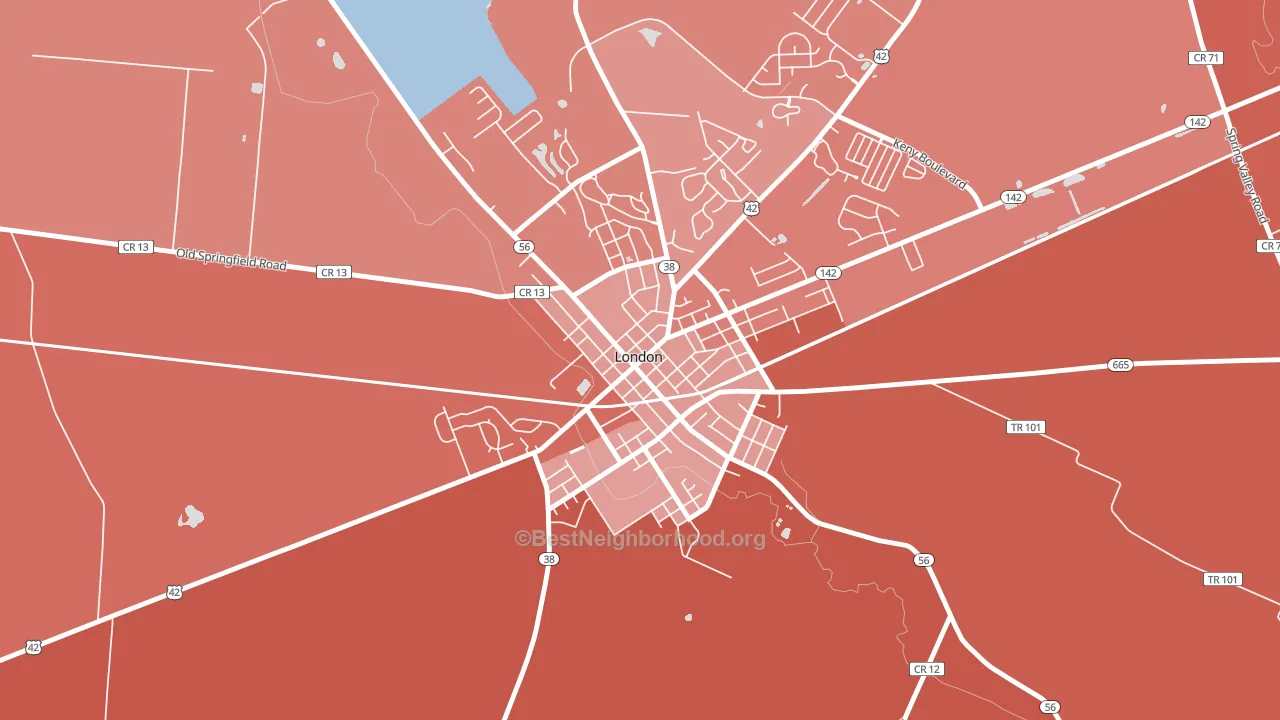
London Historic District leans heavily Republican by roughly 30 points: about 35% of voters vote Democratic and 65% Republican.
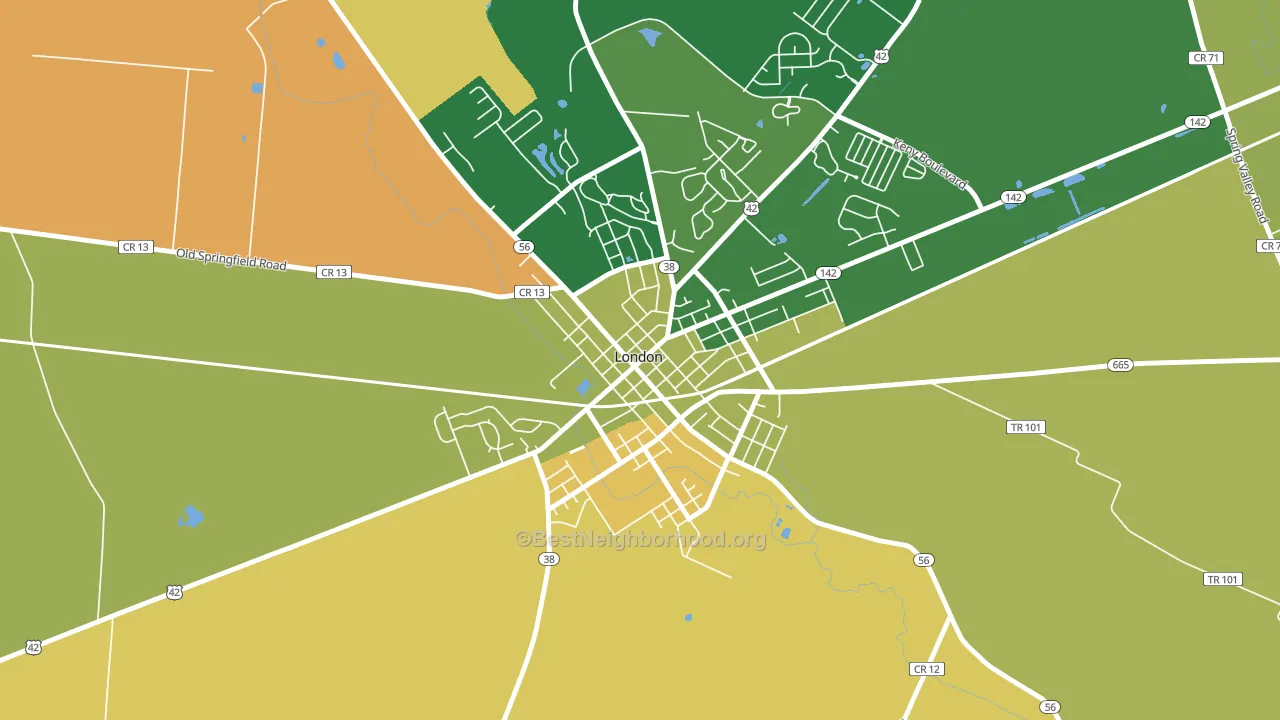
About 72% of adults in London Historic District typically vote, above the U.S. average of about 62%. Among adults in London Historic District, ~25% vote Democratic, ~47% Republican, and ~28% don't vote. The map below shows estimated turnout by block group.
How London Historic District compares
London Historic District runs about 20 points more Republican than Ohio as a whole.
Politics vary noticeably by block within London Historic District. The southwest side is the most Republican-leaning (R+46) and the east side is the least Republican-leaning (R+21), a spread of about 25 points.
Why London Historic District leans the way it does
This analysis examined 14,881 data points per neighborhood to find what predicts political lean and turnout. The items below are a few correlations that stood out for London Historic District, not a ranked or complete list of what matters most.
Areas with a high white share and below-average college attainment vote Republican. In London Historic District, about 87% of residents are non-Hispanic white, about 14 points above the U.S. average of 72%; about 22% of adults hold a bachelor's degree, about 7 points below the U.S. average of 28%. Rural areas vote Republican, and London Historic District sits in the bottom quarter on density (about 68%, below 79% of neighborhoods).
Population density and Republican lean
Places with low population density tend to lean Republican; London Historic District, London, OH sits below the national average on this measure.
Why turnout in London Historic District looks the way it does
Turnout in London Historic District sits close to the national pattern. Learn more about the findings and methodology on the political spectrum map.
Nearby Neighborhoods
- Westland, Galloway, OH Even
- West Columbus Interim, Hilliard, OH D+9
- Lagonda, Springfield, OH R+18
- North Hill, Springfield, OH D+14
- South Fountain Avenue Historic District, Springfield, OH D+40
- Tuttle West, Dublin, OH D+14
- Scioto Woods, Columbus, OH D+19
- Greater Hilltop, Columbus, OH D+16
- West Gate, Columbus, OH D+27
- Ridgewood, Springfield, OH R+4
Neighborhoods with Similar Populations
- Hunterwood, Houston, TX D+28
- Carthage, Cincinnati, OH D+34
- Whittier, Sioux Falls, SD D+10
- Holiday Park, Palm Bay, FL R+9
- Park Farms, Kansas City, MO D+51
- East Community Team North, Kansas City, MO D+56
- Center Street Historic District, Ashland, OH R+23
- Indian Village, Lincoln, NE D+32
- Nob Hill, Albuquerque, NM D+72
- South 39th Street, Missoula, MT D+14
Sources and methodology
Precinct-level voting records used to fit the model come from Ohio Secretary of State, Elections, distributed by the Voting and Election Science Team. Demographic inputs come from the U.S. Census Bureau (ACS 5-year estimates and the 2020 Decennial Census). Health and environmental inputs come from the CDC (PLACES and the Environmental Justice Index). Land cover comes from the USGS and EPA. Election-day and lead-up weather come from PRISM 4km daily grids and the NOAA Global Historical Climatology Network. Mail-voting and election-administration patterns come from the MIT Election Lab's Survey of the Performance of American Elections. Block-group crime detail comes from CrimeGrade. Internet data and modeling support provided by ISPreports.org.
Modeling and analysis by the BestNeighborhood data science team. Full methodology and findings: political spectrum map.
Methodology reviewed by the BestNeighborhood data team. Last updated May 2026.