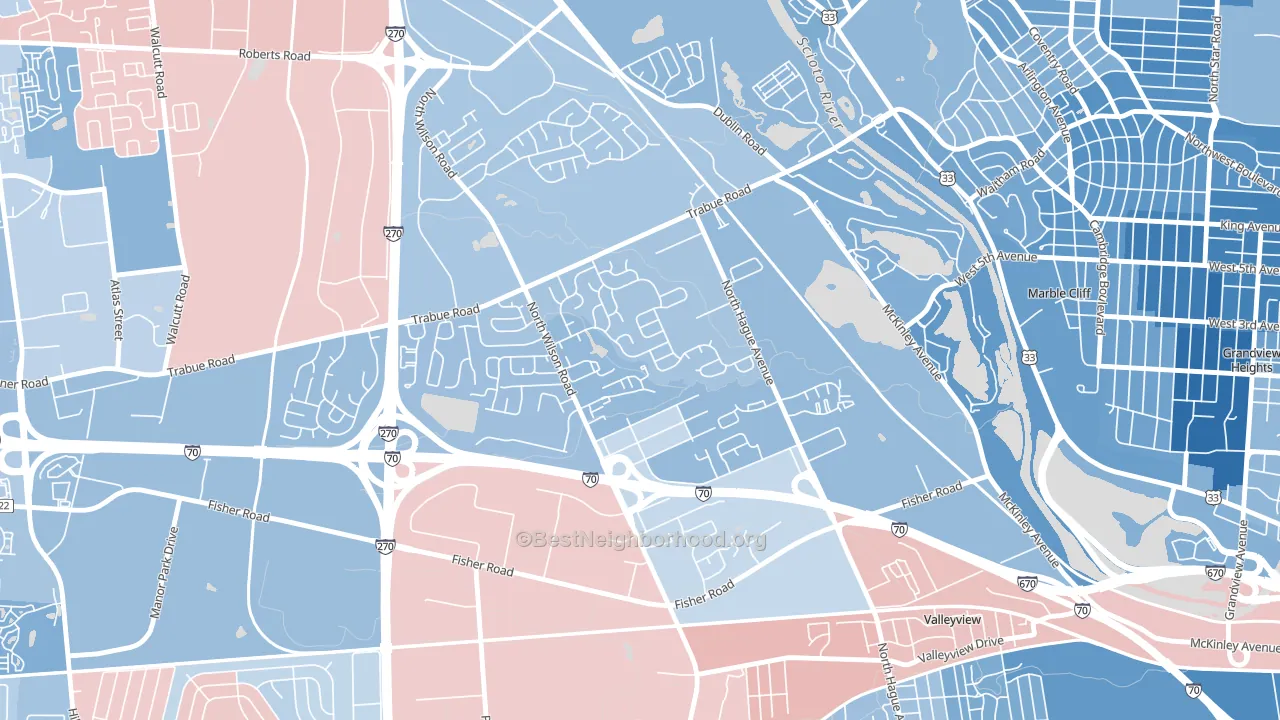
Scioto Woods leans Democratic by roughly 18 points: about 59% of voters vote Democratic and 41% Republican.
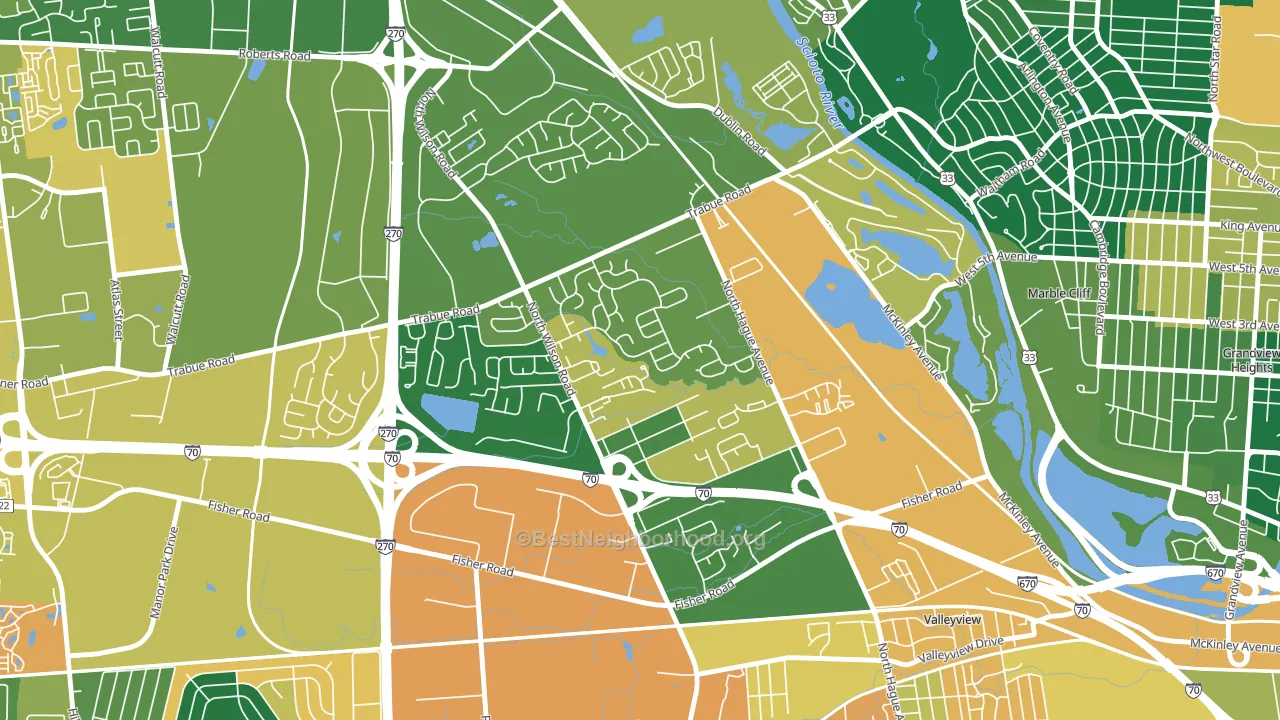
About 74% of adults in Scioto Woods typically vote, above the U.S. average of about 62%. Among adults in Scioto Woods, ~43% vote Democratic, ~30% Republican, and ~27% don't vote. The map below shows estimated turnout by block group.
How Scioto Woods compares
Among neighborhoods within 5 miles, Scioto Woods leans more Democratic than 4 of 13 neighbors.
Scioto Woods runs about 30 points more Democratic than Ohio as a whole. Ohio leans Republican overall, while Scioto Woods is one of the few Democratic-leaning pockets.
Why Scioto Woods leans the way it does
This analysis examined 14,881 data points per neighborhood to find what predicts political lean and turnout. The items below are a few correlations that stood out for Scioto Woods, not a ranked or complete list of what matters most.
Scioto Woods votes against the grain of Ohio. Ohio leans Republican overall, while Scioto Woods runs about 30 points more Democratic.
Frequent mental distress and voter turnout
Places with a low frequent-mental-distress rate tend to turn out at a higher rate; Scioto Woods, Columbus, OH sits below the national average on this measure. Reported mental distress does not drive turnout; it reflects economic and health conditions tied to voting.
Why turnout in Scioto Woods looks the way it does
Turnout in Scioto Woods sits close to the national pattern. Routine healthcare access, homeownership, education, and food security all land near their national averages here. Learn more about the findings and methodology on the political spectrum map.
Nearby Neighborhoods
- McKinley Avenue Corridor, Columbus, OH D+34
- West Gate, Columbus, OH D+27
- Fifth by Northwest, Columbus, OH D+48
- Scioto Trace, Columbus, OH D+19
- West Columbus Interim, Hilliard, OH D+9
- Greater Hilltop, Columbus, OH D+16
- Tri-Village, Columbus, OH D+48
- Franklinton, Columbus, OH D+35
- Harrison West, Columbus, OH D+54
- Westland, Galloway, OH Even
Neighborhoods with Similar Populations
- East Isles, Minneapolis, MN D+81
- East Augusta, Augusta, GA D+80
- Avalon, Albuquerque, NM D+17
- Central Business District-Buffalo, Buffalo, NY D+61
- Hamlin Park, Chicago, IL D+63
- Brookview, Waco, TX D+6
- Middletown-Pelham Bay, Bronx, NY D+12
- Anatolia Village, Rancho Cordova, CA D+10
- Armory Park, Tucson, AZ D+59
- Granite Hills, El Cajon, CA R+33
Sources and methodology
Precinct-level voting records used to fit the model come from Ohio Secretary of State, Elections, distributed by the Voting and Election Science Team. Demographic inputs come from the U.S. Census Bureau (ACS 5-year estimates and the 2020 Decennial Census). Health and environmental inputs come from the CDC (PLACES and the Environmental Justice Index). Land cover comes from the USGS and EPA. Election-day and lead-up weather come from PRISM 4km daily grids and the NOAA Global Historical Climatology Network. Mail-voting and election-administration patterns come from the MIT Election Lab's Survey of the Performance of American Elections. Block-group crime detail comes from CrimeGrade. Internet data and modeling support provided by ISPreports.org.
Modeling and analysis by the BestNeighborhood data science team. Full methodology and findings: political spectrum map.
Methodology reviewed by the BestNeighborhood data team. Last updated May 2026.