Los Montoyas leans Democratic by roughly 30 points: about 65% of voters vote Democratic and 35% Republican.
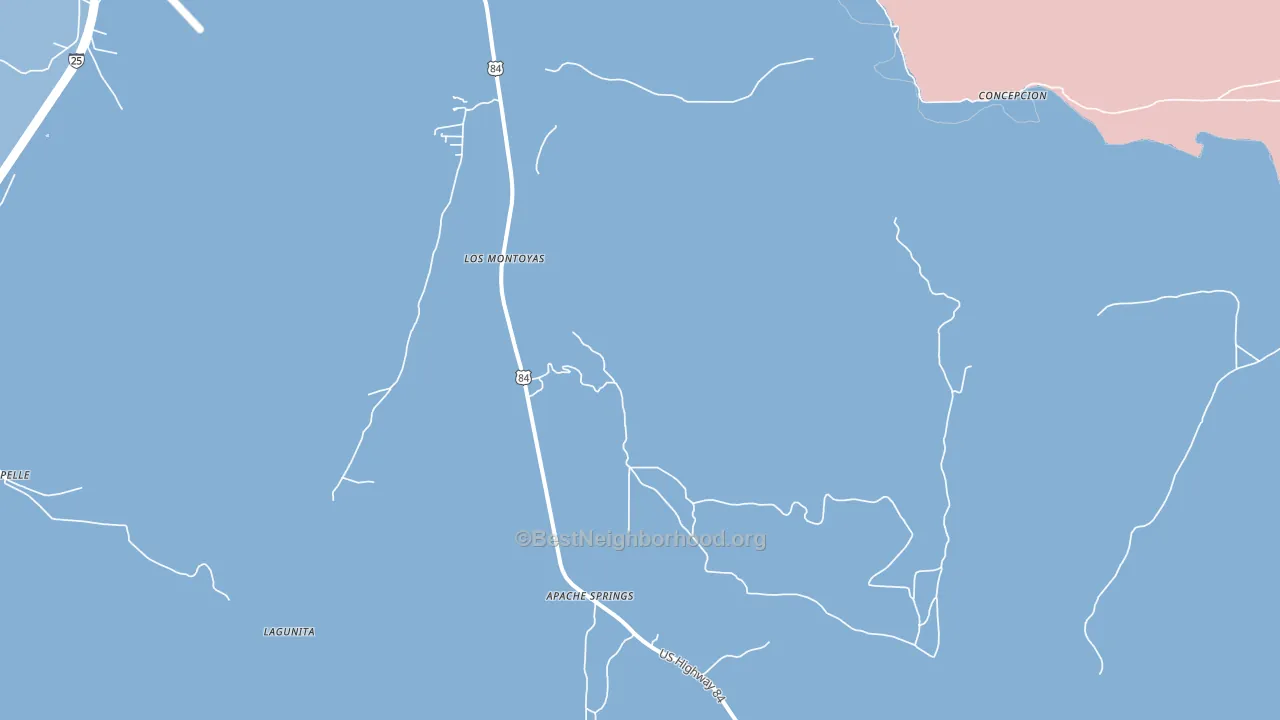
About 36% of adults in Los Montoyas typically vote, below the U.S. average of about 62%. Among adults in Los Montoyas, ~23% vote Democratic, ~13% Republican, and ~64% don't vote. The map below shows estimated turnout by block group.
How Los Montoyas compares
Among cities within 25 miles, Los Montoyas leans more Democratic than 20 of 28 neighbors.
Los Montoyas runs about 23 points more Democratic than New Mexico as a whole.
Why Los Montoyas leans the way it does
This analysis examined 14,881 data points per city to find what predicts political lean and turnout. The items below are a few correlations that stood out for Los Montoyas, not a ranked or complete list of what matters most.
Areas with many never-married adults vote Democratic. About 42% of adults in Los Montoyas have never been married, well above similar-sized cities (around 21%).
Cancer-screening access and voter turnout
Places with low colon-cancer-screening access tend to turn out at a lower rate; Los Montoyas, NM sits in the bottom tenth nationally on this measure. Cancer screening does not drive turnout; it reflects income, insurance, and healthcare access.
Why turnout in Los Montoyas looks the way it does
Areas with limited routine healthcare access turn out at lower rates. Los Montoyas is in the bottom quarter nationally for routine-care measures such as insurance coverage, preventive screenings, and dental visits. The uninsured rate here is about 22%, about 6 points above the New Mexico average of 16%. High food insecurity lines up with lower turnout, and about 27% of adults in Los Montoyas report food insecurity, above 93% of cities. Learn more about the findings and methodology on the political spectrum map.
Nearby Cities
- Chapelle, NM D+29
- Tecolote, NM D+17
- La Manga, NM D+11
- Gabaldon, NM Even
- Serafina, NM D+32
- Romeroville, NM D+5
- Villanueva, NM D+39
- Anton Chico, NM D+12
- Sena, NM D+40
Cities with Similar Populations
- Alton, KS R+79
- Martinsville, WI D+14
- Cutlips, WV R+62
- Saddle, AR R+65
- Maxville, WI R+37
- Sheltons, LA R+48
- Sheppard, AR R+41
- Coffman, MO R+58
- Struble, IA R+60
- Stotesbury, MO R+67
Sources and methodology
Precinct-level voting records used to fit the model come from New Mexico Secretary of State, Bureau of Elections, distributed by the Voting and Election Science Team. Demographic inputs come from the U.S. Census Bureau (ACS 5-year estimates and the 2020 Decennial Census). Health and environmental inputs come from the CDC (PLACES and the Environmental Justice Index). Land cover comes from the USGS and EPA. Election-day and lead-up weather come from PRISM 4km daily grids and the NOAA Global Historical Climatology Network. Mail-voting and election-administration patterns come from the MIT Election Lab's Survey of the Performance of American Elections. Block-group crime detail comes from CrimeGrade. Internet data and modeling support provided by ISPreports.org.
Modeling and analysis by the BestNeighborhood data science team. Full methodology and findings: political spectrum map.
Methodology reviewed by the BestNeighborhood data team. Last updated May 2026.