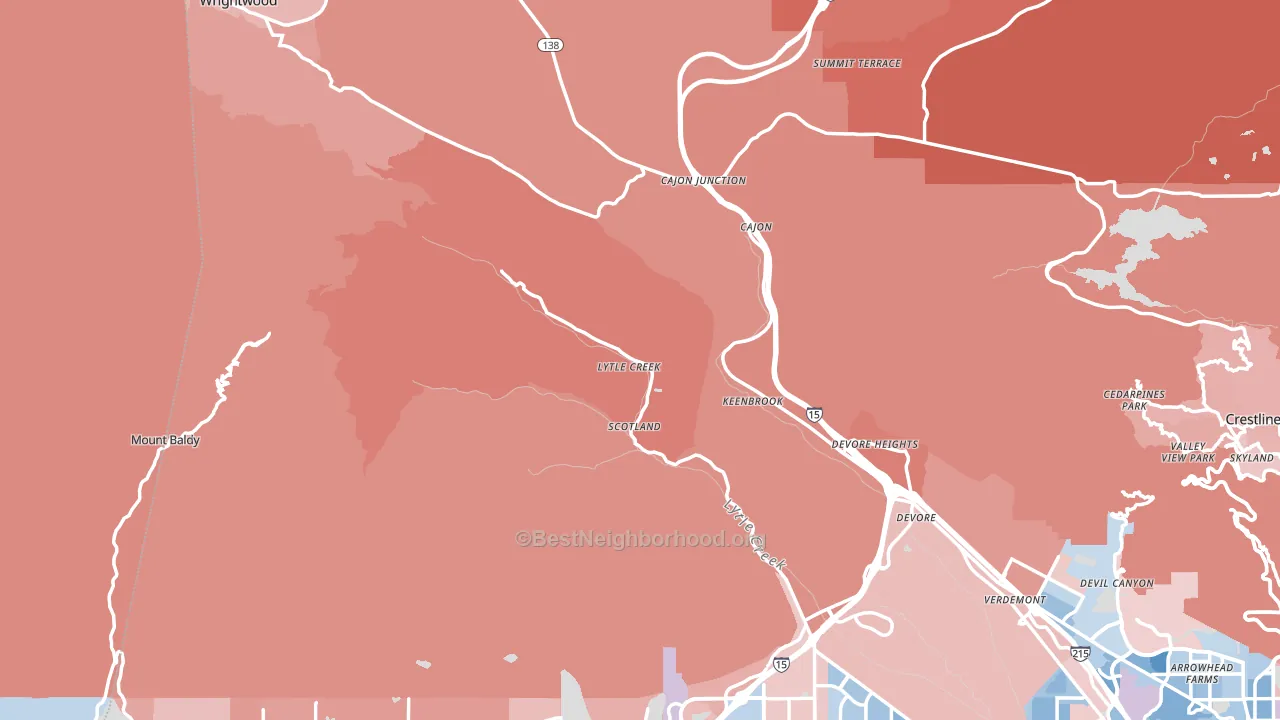
Lytle Creek leans Republican by roughly 26 points: about 37% of voters vote Democratic and 63% Republican.
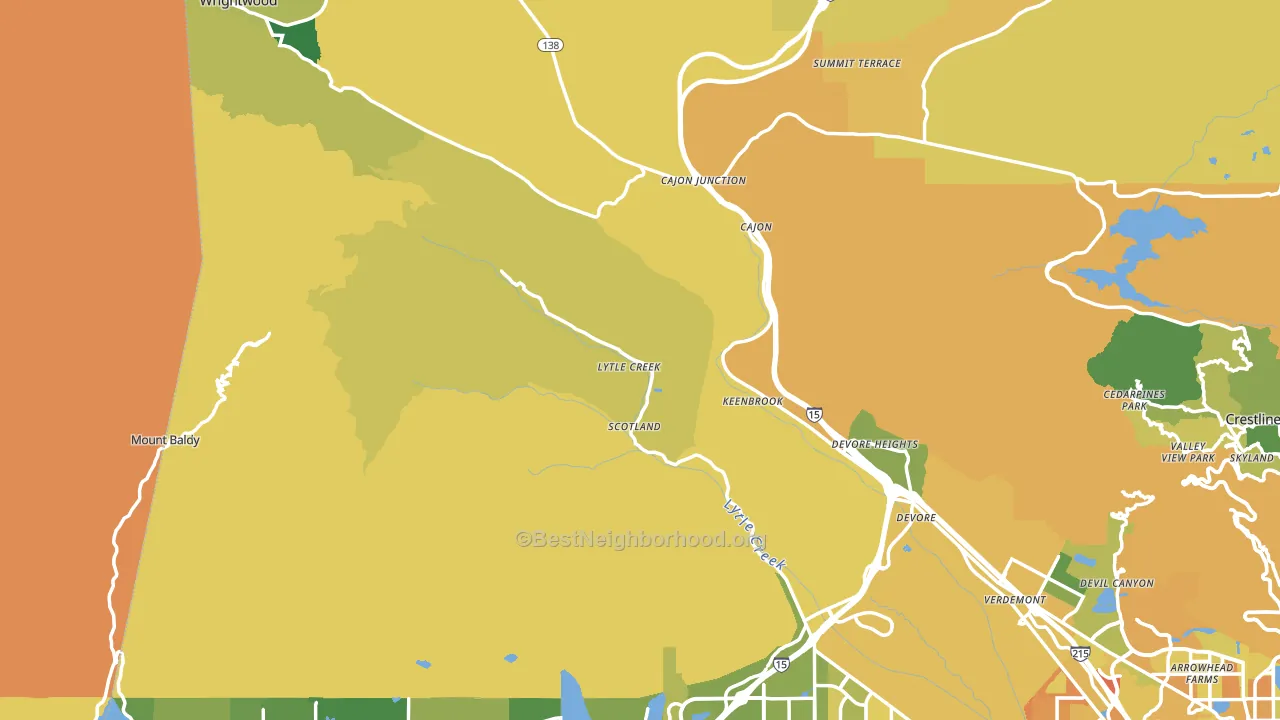
About 58% of adults in Lytle Creek typically vote, near the U.S. average of about 62%. Among adults in Lytle Creek, ~21% vote Democratic, ~37% Republican, and ~42% don't vote. The map below shows estimated turnout by block group.
How Lytle Creek compares
Among cities within 25 miles, Lytle Creek leans more Republican than 50 of 57 neighbors.
Lytle Creek runs about 47 points more Republican than California as a whole. California leans Democratic overall, while Lytle Creek is one of the few Republican-leaning pockets.
Politics vary noticeably by neighborhood within Lytle Creek. The west side is the most Republican-leaning (R+30) and the southeast side is the least Republican-leaning (R+5), a spread of about 25 points.
Why Lytle Creek leans the way it does
This analysis examined 14,881 data points per city to find what predicts political lean and turnout. The items below are a few correlations that stood out for Lytle Creek, not a ranked or complete list of what matters most.
Car-dependent areas vote Republican. About 91% of residents in Lytle Creek drive to work alone, about 17 points above the U.S. average of 74%. Lytle Creek runs against the grain of California, a Republican-leaning pocket in a Democratic-leaning state.
Cancer-screening access and voter turnout
Places with low colon-cancer-screening access tend to turn out at a lower rate; Lytle Creek, CA sits in the bottom quarter nationally on this measure. Cancer screening does not drive turnout; it reflects income, insurance, and healthcare access.
Why turnout in Lytle Creek looks the way it does
Areas with low high-school completion turn out at lower rates. About 85% of adults in Lytle Creek have completed high school, below 80% of cities. Learn more about the findings and methodology on the political spectrum map.
Nearby Cities
- Devore Heights, CA R+30
- Devore, CA R+4
- Mount Baldy, CA R+19
- Alta Loma, CA R+14
- Wrightwood, CA R+15
- Devore Hghts, CA D+3
- Cedarpines Park, CA R+20
- Rancho Cucamonga, CA Even
- Oak Hills, CA R+39
- Fontana, CA D+14
Cities with Similar Populations
- Blain, PA R+66
- Alfred Mills, ME R+25
- Chevak, AK D+22
- Portland, NY R+27
- Langdon Place, KY D+19
- Belleville, WV R+61
- Damascus, PA R+34
- Cartersburg, IN R+46
- Mirror Lake, NH D+5
- Lewiston, LA R+56
Sources and methodology
Precinct-level voting records used to fit the model come from California Secretary of State, Elections, distributed by the Voting and Election Science Team. Demographic inputs come from the U.S. Census Bureau (ACS 5-year estimates and the 2020 Decennial Census). Health and environmental inputs come from the CDC (PLACES and the Environmental Justice Index). Land cover comes from the USGS and EPA. Election-day and lead-up weather come from PRISM 4km daily grids and the NOAA Global Historical Climatology Network. Mail-voting and election-administration patterns come from the MIT Election Lab's Survey of the Performance of American Elections. Block-group crime detail comes from CrimeGrade. Internet data and modeling support provided by ISPreports.org.
Modeling and analysis by the BestNeighborhood data science team. Full methodology and findings: political spectrum map.
Methodology reviewed by the BestNeighborhood data team. Last updated May 2026.