Meadow Valley leans slightly Republican by roughly 12 points: about 44% of voters vote Democratic and 56% Republican.
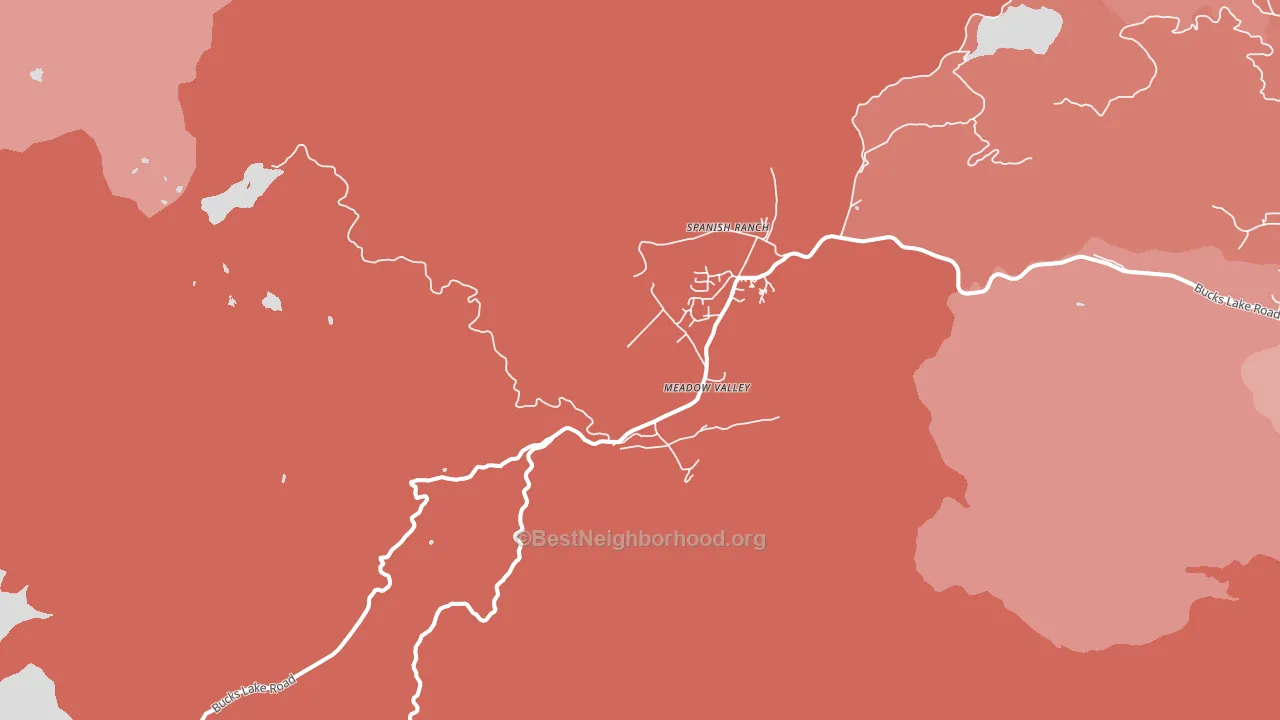
About 53% of adults in Meadow Valley typically vote, below the U.S. average of about 62%. Among adults in Meadow Valley, ~23% vote Democratic, ~30% Republican, and ~47% don't vote. The map below shows estimated turnout by block group.
How Meadow Valley compares
Among cities within 25 miles, Meadow Valley leans more Republican than 8 of 21 neighbors.
Meadow Valley runs about 32 points more Republican than California as a whole. California leans Democratic overall, while Meadow Valley is one of the few Republican-leaning pockets.
Why Meadow Valley leans the way it does
This analysis examined 14,881 data points per city to find what predicts political lean and turnout. The items below are a few correlations that stood out for Meadow Valley, not a ranked or complete list of what matters most.
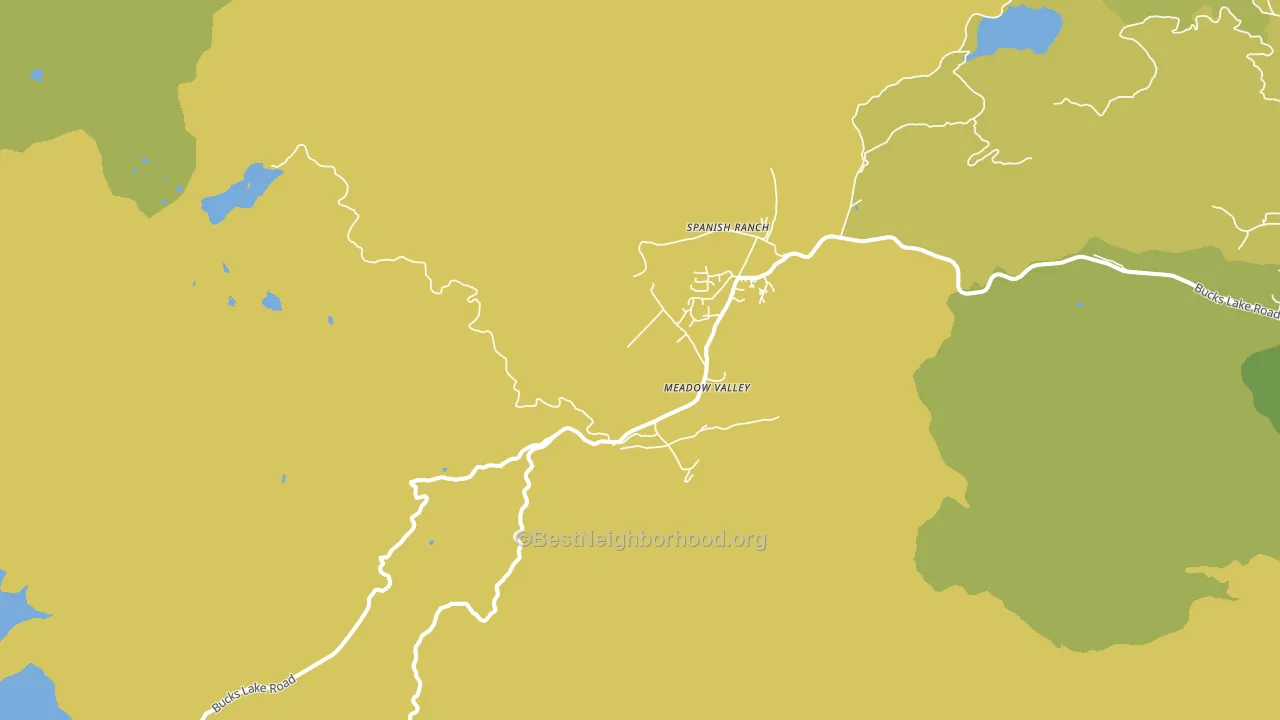
Rural areas vote Republican. About 4% of residents in Meadow Valley live in densely developed areas, about 54 points below the California average of 58%. A high white share with below-average college attainment predicts Republican voting, and Meadow Valley fits that profile on both counts. Meadow Valley runs against the grain of California, a Republican-leaning pocket in a Democratic-leaning state.
Paved land cover and Republican lean
Places with little paved surface tend to lean Republican; Meadow Valley, CA sits in the bottom quarter nationally on this measure. Paved ground does not change how people vote; it mostly reflects how urban and built-up a place is.
Why turnout in Meadow Valley looks the way it does
Crowded housing lines up with lower turnout. About 7% of homes in Meadow Valley have more than one occupant per room, above 94% of cities. Strong routine healthcare access lines up with higher turnout, and Meadow Valley sits in the top quarter on routine-care measures. Renters vote less often than owners, and about 29% of households in Meadow Valley rent, above 82% of cities. Learn more about the findings and methodology on the political spectrum map.
Nearby Cities
- Spanish Ranch, CA R+29
- Keddie, CA R+24
- Quincy, CA R+25
- East Quincy, CA R+21
- Indian Falls, CA R+6
- Belden, CA R+3
- Crescent Mills, CA R+3
- Greenville, CA R+22
Cities with Similar Populations
- Burns, KS R+62
- Fay, OK R+72
- Labish Village, OR R+41
- Etter, TX R+65
- College City, AR R+73
- Mcclusky, ND R+69
- Judy, KY R+58
- Holland, WI R+45
- Old Ripley, IL R+54
- New Haven, OH R+53
Sources and methodology
Precinct-level voting records used to fit the model come from California Secretary of State, Elections, distributed by the Voting and Election Science Team. Demographic inputs come from the U.S. Census Bureau (ACS 5-year estimates and the 2020 Decennial Census). Health and environmental inputs come from the CDC (PLACES and the Environmental Justice Index). Land cover comes from the USGS and EPA. Election-day and lead-up weather come from PRISM 4km daily grids and the NOAA Global Historical Climatology Network. Mail-voting and election-administration patterns come from the MIT Election Lab's Survey of the Performance of American Elections. Block-group crime detail comes from CrimeGrade. Internet data and modeling support provided by ISPreports.org.
Modeling and analysis by the BestNeighborhood data science team. Full methodology and findings: political spectrum map.
Methodology reviewed by the BestNeighborhood data team. Last updated May 2026.