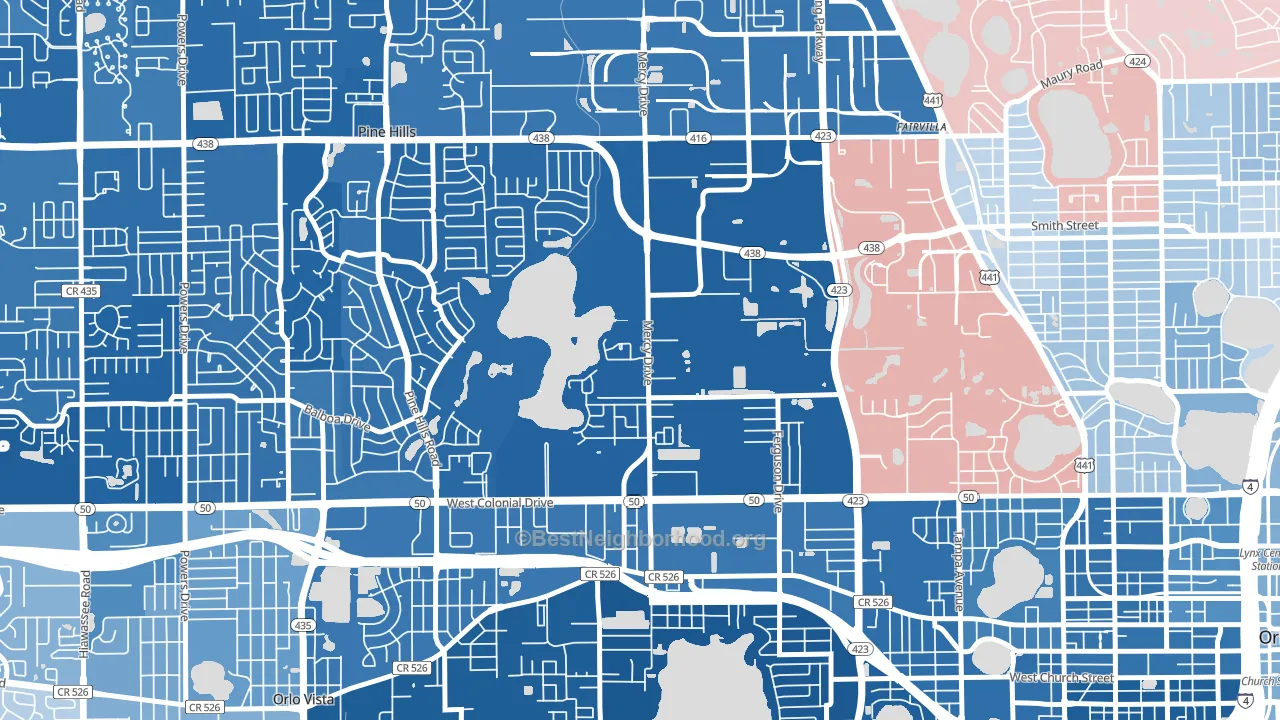
Mercy Drive is a Democratic stronghold. About 86% of voters here vote Democratic and 14% Republican.
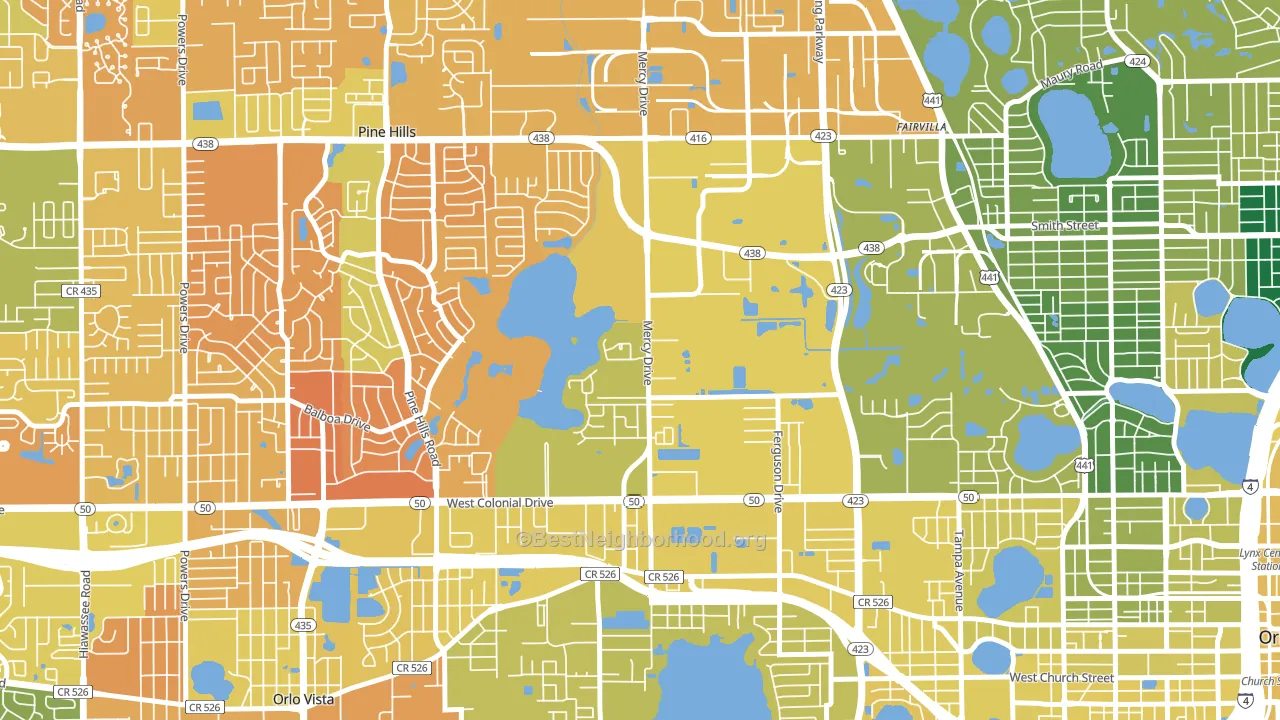
About 61% of adults in Mercy Drive typically vote, near the U.S. average of about 62%. Among adults in Mercy Drive, ~52% vote Democratic, ~8% Republican, and ~40% don't vote. The map below shows estimated turnout by block group.
How Mercy Drive compares
Among neighborhoods within 5 miles, Mercy Drive leans more Democratic than 16 of 17 neighbors.
Mercy Drive runs about 85 points more Democratic than Florida as a whole. Florida leans Republican overall, while Mercy Drive is one of the few Democratic-leaning pockets.
Why Mercy Drive leans the way it does
This analysis examined 14,881 data points per neighborhood to find what predicts political lean and turnout. The items below are a few correlations that stood out for Mercy Drive, not a ranked or complete list of what matters most.
Rural, majority-Black areas of the Southern Black Belt vote Democratic, against the usual rural pattern. About 87% of residents in Mercy Drive are Black or African American, about 74 points above the Florida average of 13%. A high never-married share predicts Democratic voting, and about 53% of adults in Mercy Drive have never been married, above 86% of neighborhoods. Mercy Drive runs against the grain of Florida, a Democratic-leaning pocket in a Republican-leaning state.
Preventive-care access and voter turnout
Places with limited routine preventive-care access tend to turn out at a lower rate; Mercy Drive, Orlando, FL sits in the bottom tenth nationally on this measure. Dental visits do not drive turnout; the rate reflects income, insurance, and healthcare access, which line up with who votes.
Why turnout in Mercy Drive looks the way it does
Areas with limited routine healthcare access turn out at lower rates. Mercy Drive is in the bottom quarter nationally for routine-care measures such as insurance coverage, preventive screenings, and dental visits. The dental-visit rate here is about 43%, about 13 points below the Florida average of 56%. Renters vote less often than owners, and about 80% of households in Mercy Drive rent, compared to around 61% in nearby neighborhoods. High-crime urban areas turn out at lower rates, and Mercy Drive sits in the top 15% on a violent-crime measure. Learn more about the findings and methodology on the political spectrum map.
Nearby Neighborhoods
- Forest Park, Pine Hills, FL D+69
- College Park, Orlando, FL D+14
- Rosemont, Orlando, FL D+55
- Rosemont North, Orlando, FL D+65
- Richmond Heights-Orlando, Orlando, FL D+83
- Holden-Parramore, Orlando, FL D+71
- North Orange, Orlando, FL D+15
- Westland Terrace, Pine Hills, FL D+70
- Kirkman North, Orlando, FL D+53
- Fairview Shores, Orlando, FL D+20
Neighborhoods with Similar Populations
- Central Hammond, Hammond, IN D+43
- Belaire, San Angelo, TX R+42
- Riverwalk, Porter, TX R+16
- Oak Park Northwest, Kansas City, MO D+83
- Corn Hill, Rochester, NY D+62
- Edgewood, Fort Lauderdale, FL D+5
- Rosemont North, Orlando, FL D+65
- Ardmore-Gould Estates-Olin Heights, Savannah, GA D+36
- Live Oaks Square, Tampa, FL D+69
- Meyer Park, Tempe, AZ D+29
Sources and methodology
Precinct-level voting records used to fit the model come from Florida Division of Elections, distributed by the Voting and Election Science Team. Demographic inputs come from the U.S. Census Bureau (ACS 5-year estimates and the 2020 Decennial Census). Health and environmental inputs come from the CDC (PLACES and the Environmental Justice Index). Land cover comes from the USGS and EPA. Election-day and lead-up weather come from PRISM 4km daily grids and the NOAA Global Historical Climatology Network. Mail-voting and election-administration patterns come from the MIT Election Lab's Survey of the Performance of American Elections. Block-group crime detail comes from CrimeGrade. Internet data and modeling support provided by ISPreports.org.
Modeling and analysis by the BestNeighborhood data science team. Full methodology and findings: political spectrum map.
Methodology reviewed by the BestNeighborhood data team. Last updated May 2026.