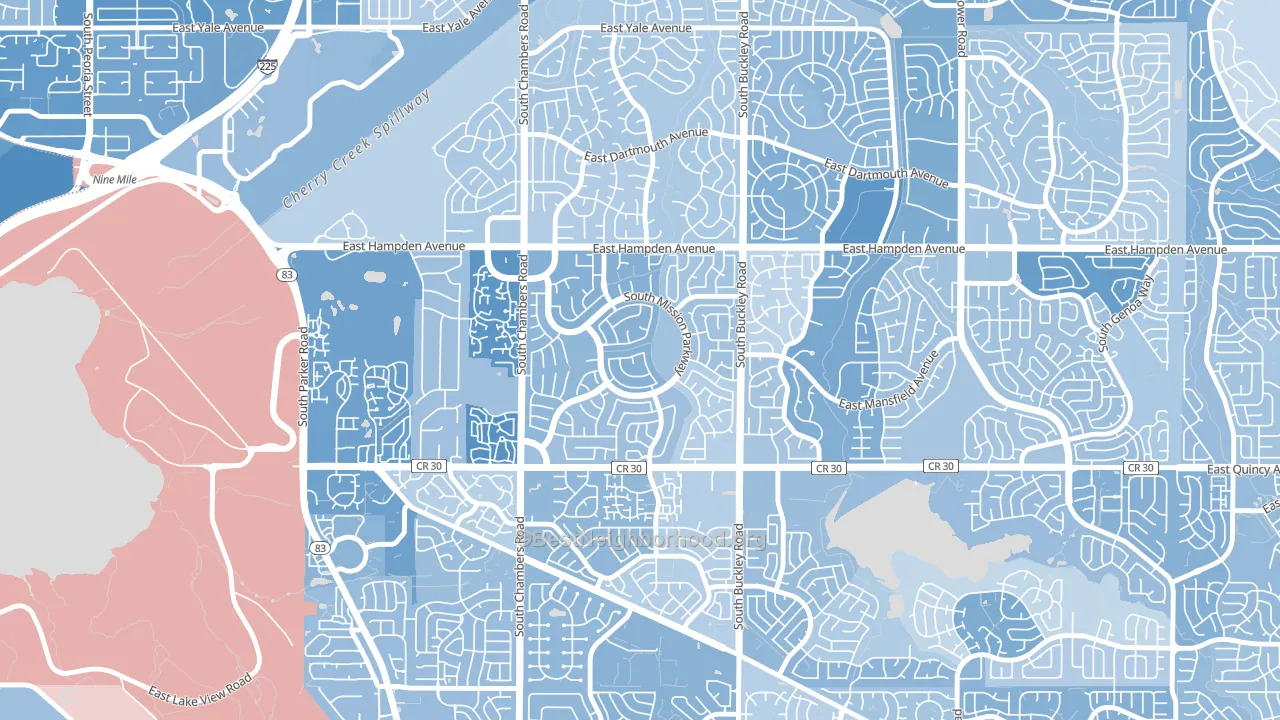
Mission Viejo leans Democratic by roughly 16 points: about 58% of voters vote Democratic and 42% Republican.
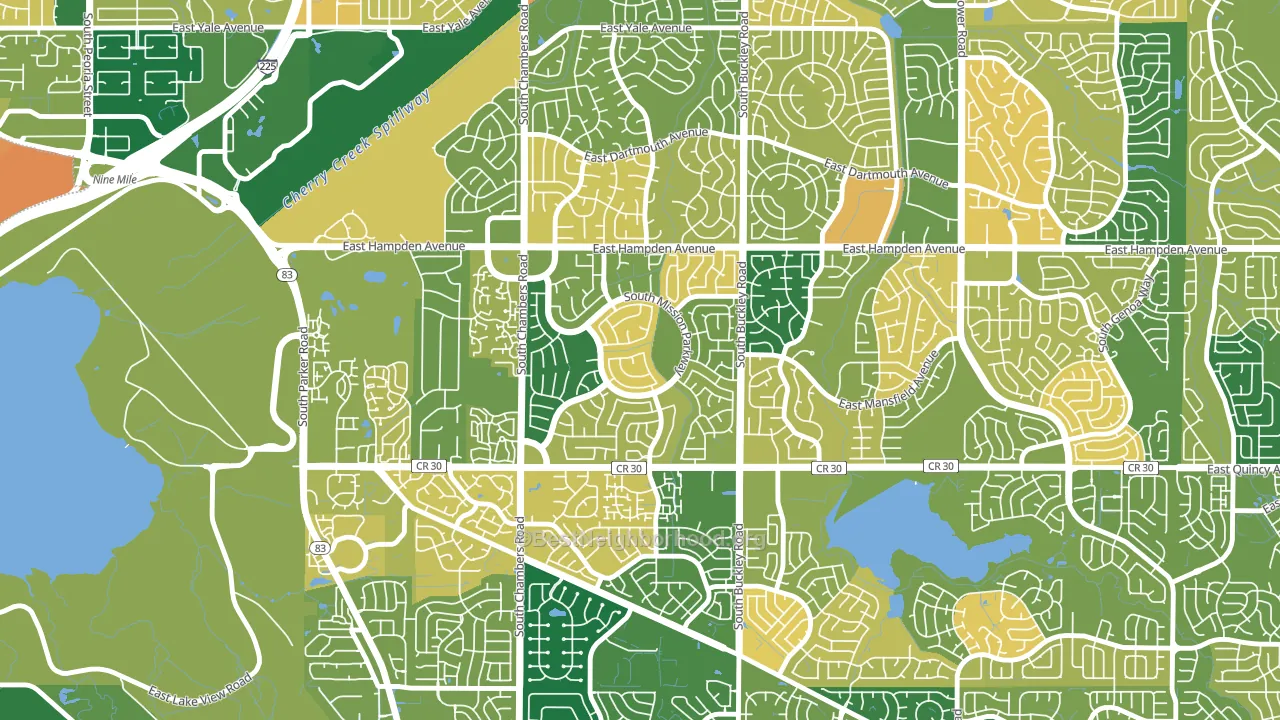
About 73% of adults in Mission Viejo typically vote, above the U.S. average of about 62%. Among adults in Mission Viejo, ~42% vote Democratic, ~31% Republican, and ~27% don't vote. The map below shows estimated turnout by block group.
How Mission Viejo compares
Among neighborhoods within 5 miles, Mission Viejo leans more Democratic than 5 of 30 neighbors.
Mission Viejo runs about 4 points more Democratic than Colorado as a whole.
Politics vary noticeably by block within Mission Viejo. The southwest side is the most Democratic-leaning (D+19) and the southeast side is the least Democratic-leaning (D+5), a spread of about 14 points.
Why Mission Viejo leans the way it does
This analysis examined 14,881 data points per neighborhood to find what predicts political lean and turnout. The items below are a few correlations that stood out for Mission Viejo, not a ranked or complete list of what matters most.
Dense areas vote Democratic. More than 99% of residents in Mission Viejo live in densely developed areas, about 64 points above the U.S. average of 36%.
Population density and Democratic lean
Places with high population density tend to lean Democratic; Mission Viejo, Aurora, CO sits in the top quarter nationally on this measure.
Why turnout in Mission Viejo looks the way it does
Homeowners vote more often than renters. About 87% of households in Mission Viejo own their home, about 12 points above the Colorado average of 75%. Learn more about the findings and methodology on the political spectrum map.
Nearby Neighborhoods
- Pheasant Run, Aurora, CO D+15
- Meadow Hills, Aurora, CO D+33
- Carriage Place, Aurora, CO D+19
- Meadow Wood, Aurora, CO D+12
- Aurora Knolls-Hutchinson Heights, Aurora, CO D+25
- Shenandoah, Aurora, CO D+23
- Prides Crossing, Aurora, CO D+13
- Heather Gardens, Aurora, CO D+24
- Seven Hills, Aurora, CO D+12
- Horseshoe Park, Aurora, CO D+24
Neighborhoods with Similar Populations
- Mt Vernon, Mount Vernon, VA D+35
- Duclay, Jacksonville, FL D+17
- North Brookline, Brookline, MA D+69
- Sunrise, San Antonio, TX D+30
- Bordeaux, Nashville, TN D+65
- Delhi, Santa Ana, CA D+33
- Bloomfield, Staten Island, NY R+37
- Downtown Crossing, Boston, MA D+61
- Crystal City, Arlington, VA D+59
- Bushrod, Oakland, CA D+85
Sources and methodology
Precinct-level voting records used to fit the model come from Colorado Secretary of State, Elections, distributed by the Voting and Election Science Team. Demographic inputs come from the U.S. Census Bureau (ACS 5-year estimates and the 2020 Decennial Census). Health and environmental inputs come from the CDC (PLACES and the Environmental Justice Index). Land cover comes from the USGS and EPA. Election-day and lead-up weather come from PRISM 4km daily grids and the NOAA Global Historical Climatology Network. Mail-voting and election-administration patterns come from the MIT Election Lab's Survey of the Performance of American Elections. Block-group crime detail comes from CrimeGrade. Internet data and modeling support provided by ISPreports.org.
Modeling and analysis by the BestNeighborhood data science team. Full methodology and findings: political spectrum map.
Methodology reviewed by the BestNeighborhood data team. Last updated May 2026.