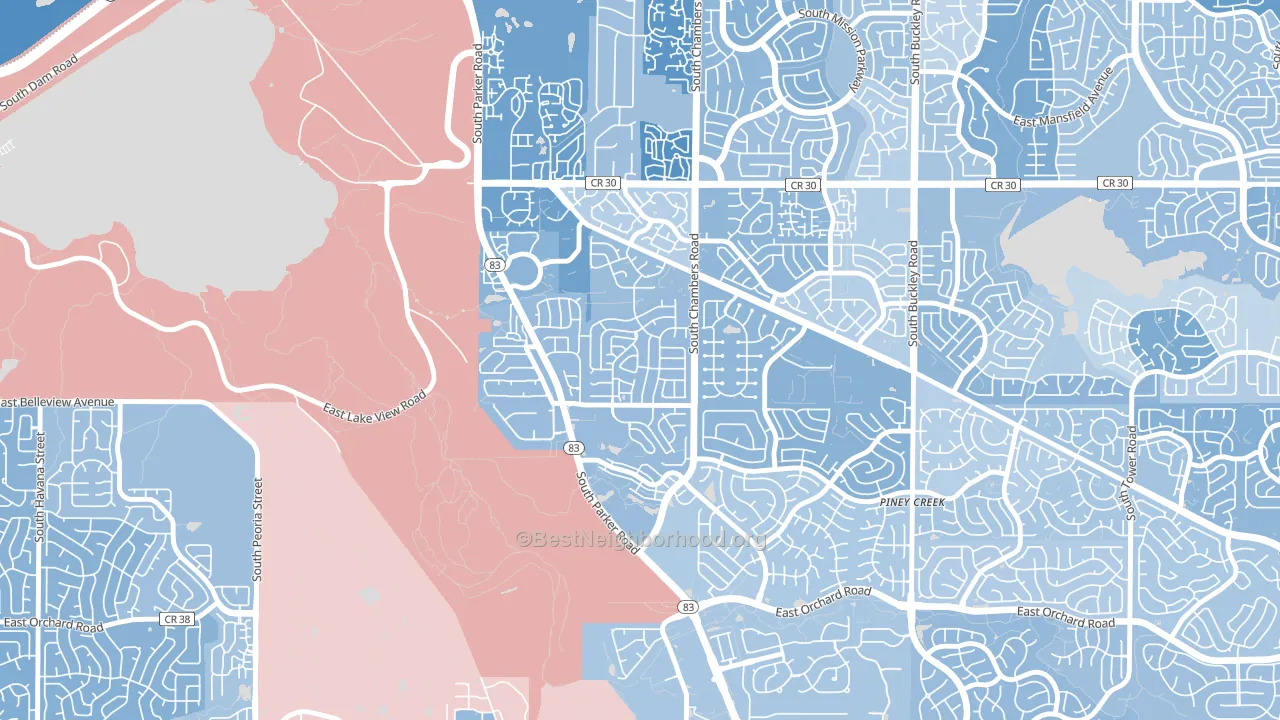
Shenandoah leans Democratic by roughly 22 points: about 61% of voters vote Democratic and 39% Republican.
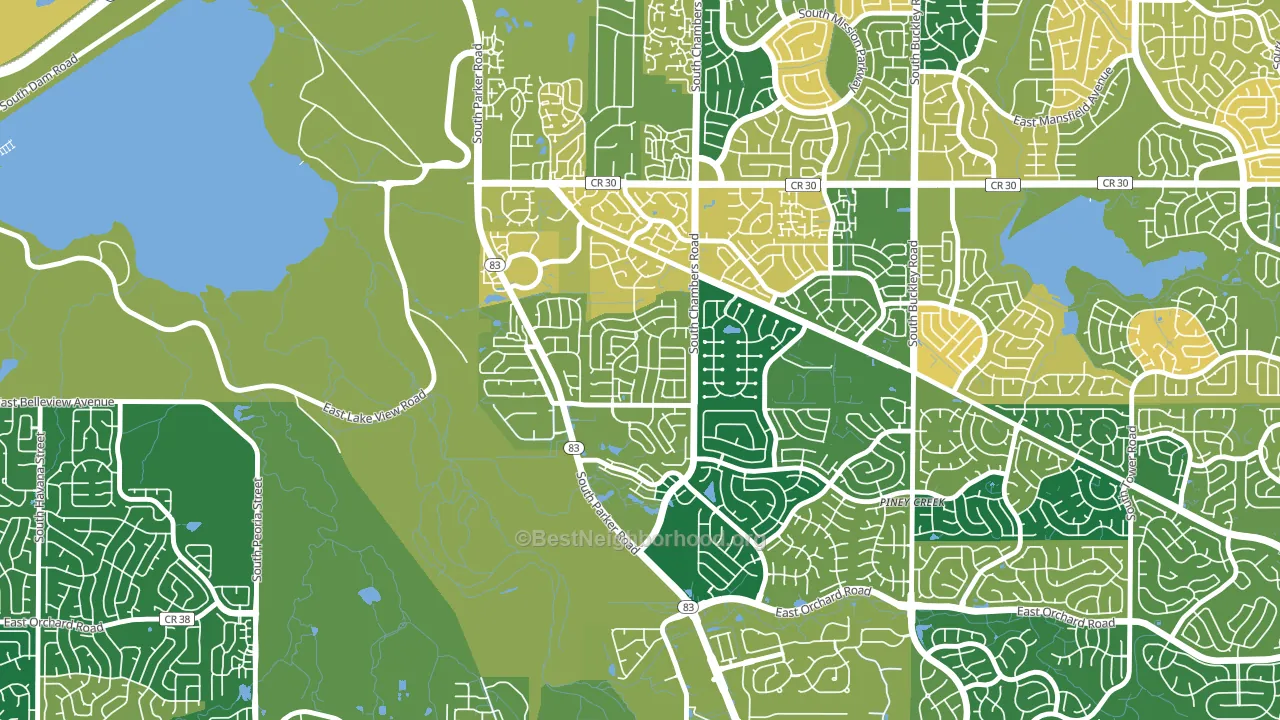
About 79% of adults in Shenandoah typically vote, above the U.S. average of about 62%. Among adults in Shenandoah, ~48% vote Democratic, ~31% Republican, and ~21% don't vote. The map below shows estimated turnout by block group.
How Shenandoah compares
Among neighborhoods within 5 miles, Shenandoah leans more Democratic than 7 of 25 neighbors.
Shenandoah runs about 12 points more Democratic than Colorado as a whole.
Why Shenandoah leans the way it does
Density, race composition, education, and family structure all sit close to their national averages in Shenandoah. The lean here lands roughly where demographic data alone would predict.
Population density and Democratic lean
Places with high population density tend to lean Democratic; Shenandoah, Aurora, CO sits in the top quarter nationally on this measure.
Why turnout in Shenandoah looks the way it does
Turnout in Shenandoah sits close to the national pattern. Routine healthcare access, homeownership, education, and food security all land near their national averages here. Learn more about the findings and methodology on the political spectrum map.
Nearby Neighborhoods
- Pheasant Run, Aurora, CO D+15
- Meadow Hills, Aurora, CO D+33
- Mission Viejo, Aurora, CO D+15
- Prides Crossing, Aurora, CO D+13
- Carriage Place, Aurora, CO D+19
- Meadow Wood, Aurora, CO D+12
- Heather Gardens, Aurora, CO D+24
- Aurora Knolls-Hutchinson Heights, Aurora, CO D+25
- Dam East-West, Aurora, CO D+36
- East Ridge-Ptarmigan Park, Aurora, CO D+34
Neighborhoods with Similar Populations
- Sans Pareil, Jacksonville, FL R+3
- Douglas Park, Arlington, VA D+53
- Brookside, Stockton, CA D+12
- Brentwood, Austin, TX D+59
- Hillside, Daly City, CA D+39
- Green Lake, Seattle, WA D+76
- Trumbull Village, Albuquerque, NM D+23
- Bulls Head, Staten Island, NY R+31
- North Shore, Haleiwa, HI D+7
- Providence Plantation, Charlotte, NC Even
Sources and methodology
Precinct-level voting records used to fit the model come from Colorado Secretary of State, Elections, distributed by the Voting and Election Science Team. Demographic inputs come from the U.S. Census Bureau (ACS 5-year estimates and the 2020 Decennial Census). Health and environmental inputs come from the CDC (PLACES and the Environmental Justice Index). Land cover comes from the USGS and EPA. Election-day and lead-up weather come from PRISM 4km daily grids and the NOAA Global Historical Climatology Network. Mail-voting and election-administration patterns come from the MIT Election Lab's Survey of the Performance of American Elections. Block-group crime detail comes from CrimeGrade. Internet data and modeling support provided by ISPreports.org.
Modeling and analysis by the BestNeighborhood data science team. Full methodology and findings: political spectrum map.
Methodology reviewed by the BestNeighborhood data team. Last updated May 2026.