Mizell leans heavily Republican by roughly 40 points: about 30% of voters vote Democratic and 70% Republican.
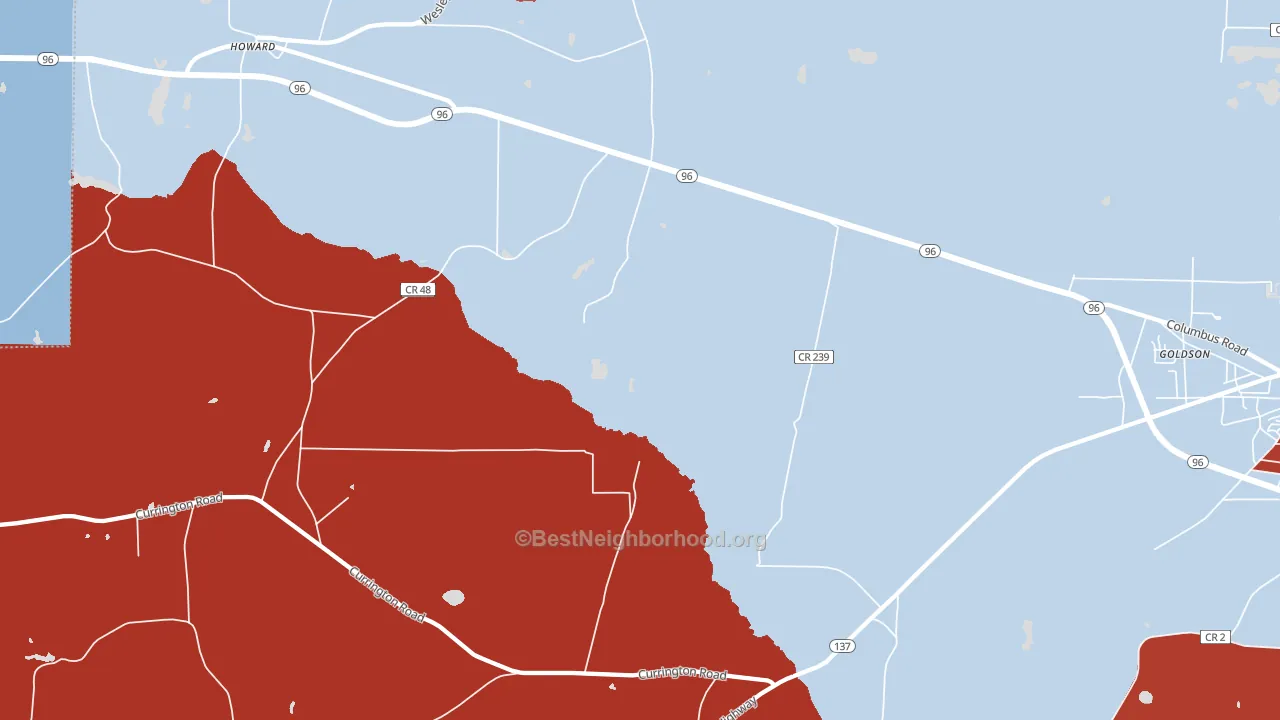
About 60% of adults in Mizell typically vote, near the U.S. average of about 62%. Among adults in Mizell, ~18% vote Democratic, ~42% Republican, and ~40% don't vote. The map below shows estimated turnout by block group.
How Mizell compares
Among cities within 25 miles, Mizell leans more Republican than 30 of 42 neighbors.
Mizell runs about 39 points more Republican than Georgia as a whole.
Politics vary noticeably by neighborhood within Mizell. The southeast side runs the most Democratic (D+7) and the west side runs the most Republican (R+69), a spread of about 76 points.
Why Mizell leans the way it does
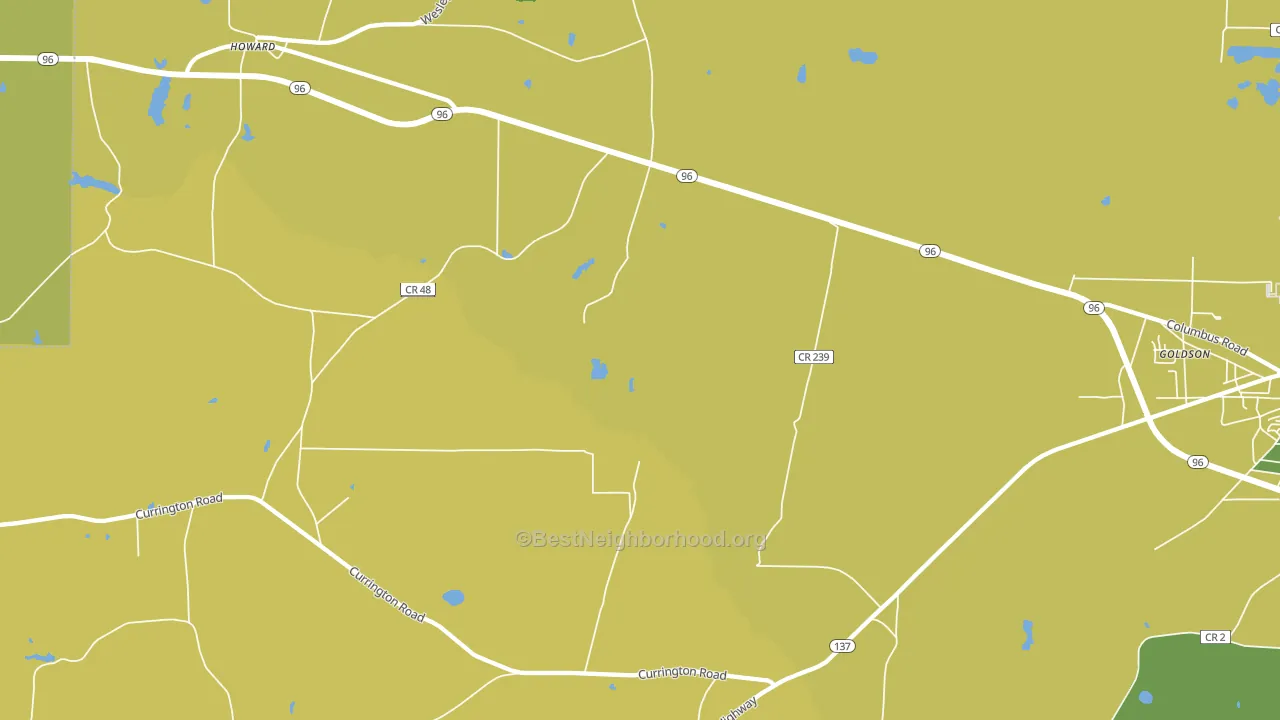
Density, race composition, education, and family structure all sit close to their national averages in Mizell. The lean here lands roughly where demographic data alone would predict.
Population density, never-married share, and Republican lean
Places that combine low population density and a never-married-heavy adult population tend to lean Republican, as Mizell, GA does.
Why turnout in Mizell looks the way it does
Areas with limited routine healthcare access turn out at lower rates. Mizell is in the bottom quarter nationally for routine-care measures such as insurance coverage, preventive screenings, and dental visits. The dental-visit rate here is about 40%, about 16 points below the Georgia average of 56%. Renters vote less often than owners, and about 40% of households in Mizell rent, above 94% of cities. High food insecurity lines up with lower turnout, and about 34% of adults in Mizell report food insecurity, above 97% of cities. Learn more about the findings and methodology on the political spectrum map.
Nearby Cities
- Howard, GA R+11
- Goldson, GA R+14
- Butler, GA R+3
- Jarrell, GA R+48
- Junction City, GA D+11
- Mauk, GA R+65
- Rupert, GA R+67
- Fickling Mill, GA R+45
- Geneva, GA D+5
- Potterville, GA R+37
Cities with Similar Populations
- Saranac Inn, NY R+9
- Ferguson Crossroads, AR R+79
- Mist, AR R+87
- Booth, AL R+25
- Spotville, AR R+52
- Harbor View, OH R+39
- Harding, MN R+68
- Mosher, SD R+61
- Womack, MO R+64
- South Corinth, NY R+31
Sources and methodology
Precinct-level voting records used to fit the model come from Georgia Elections Division, distributed by the Voting and Election Science Team. Demographic inputs come from the U.S. Census Bureau (ACS 5-year estimates and the 2020 Decennial Census). Health and environmental inputs come from the CDC (PLACES and the Environmental Justice Index). Land cover comes from the USGS and EPA. Election-day and lead-up weather come from PRISM 4km daily grids and the NOAA Global Historical Climatology Network. Mail-voting and election-administration patterns come from the MIT Election Lab's Survey of the Performance of American Elections. Block-group crime detail comes from CrimeGrade. Internet data and modeling support provided by ISPreports.org.
Modeling and analysis by the BestNeighborhood data science team. Full methodology and findings: political spectrum map.
Methodology reviewed by the BestNeighborhood data team. Last updated May 2026.