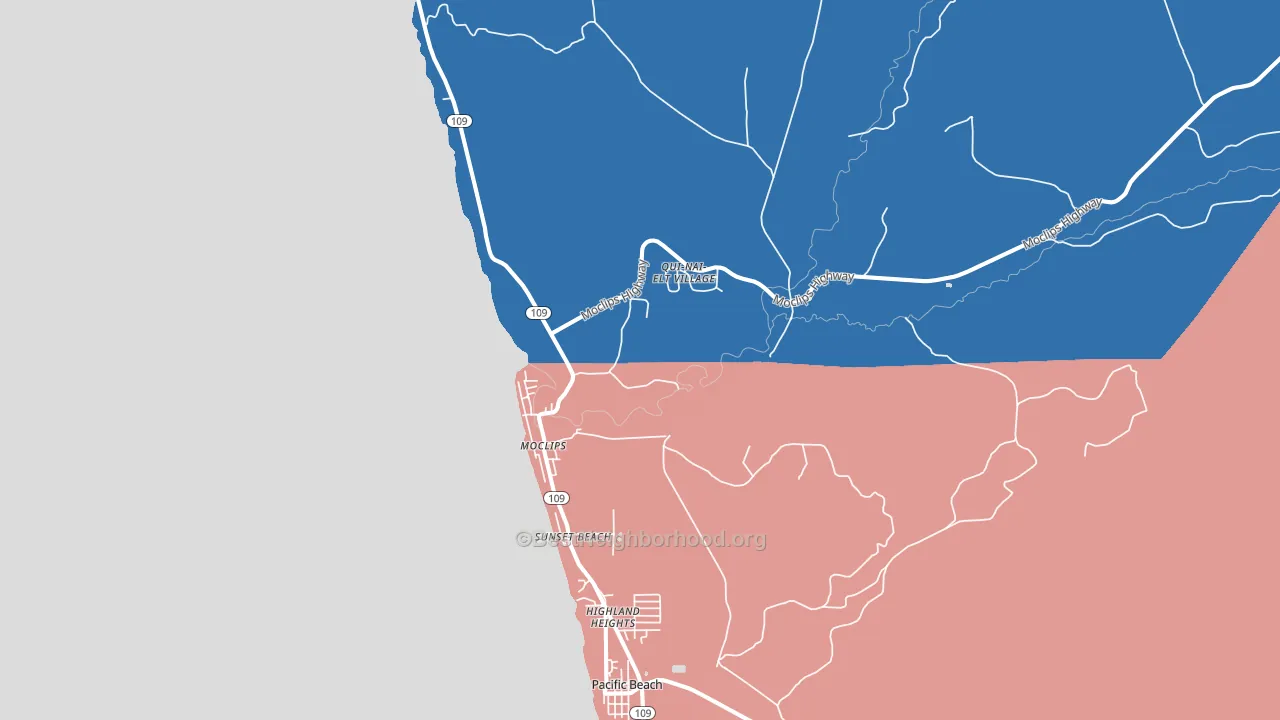
Moclips leans heavily Democratic by roughly 40 points: about 70% of voters vote Democratic and 30% Republican.
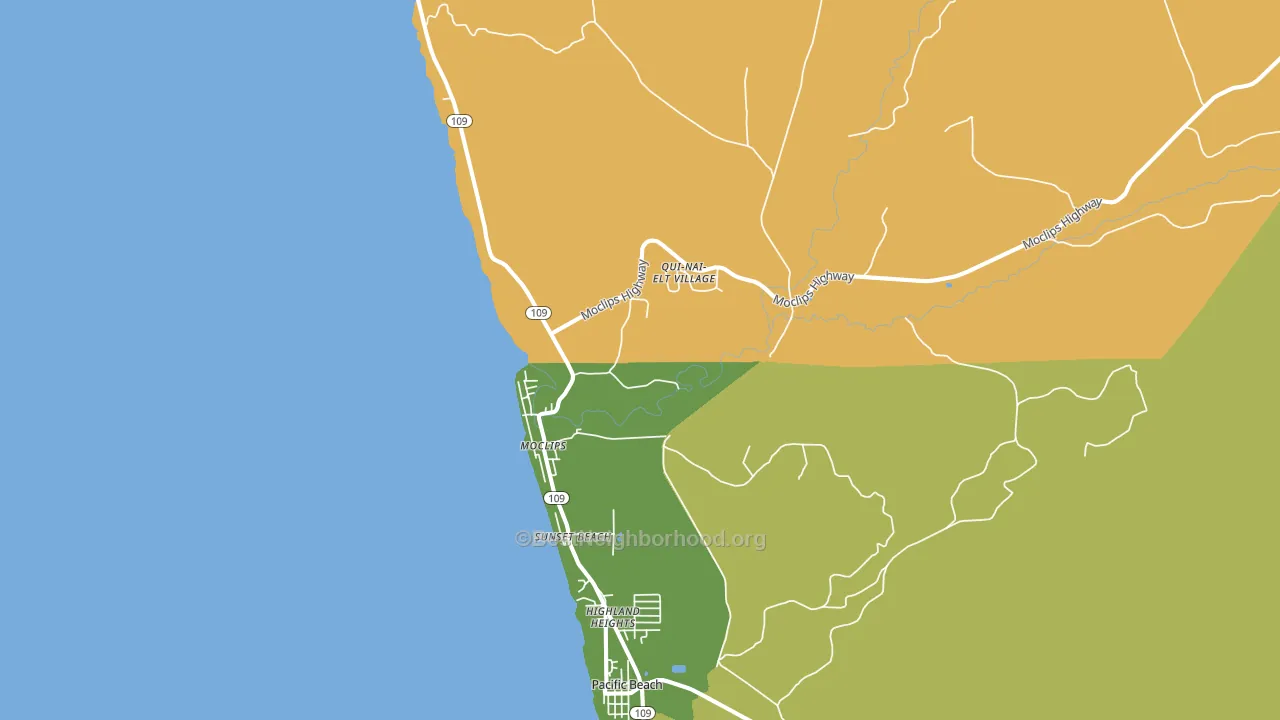
About 57% of adults in Moclips typically vote, near the U.S. average of about 62%. Among adults in Moclips, ~40% vote Democratic, ~17% Republican, and ~43% don't vote. The map below shows estimated turnout by block group.
How Moclips compares
Among cities within 25 miles, Moclips leans more Democratic than 18 of 21 neighbors.
Moclips runs about 23 points more Democratic than Washington as a whole.
Politics vary noticeably by neighborhood within Moclips. The northeast side runs the most Democratic (D+72) and the west side runs the most Republican (R+7), a spread of about 78 points.
Why Moclips leans the way it does
This analysis examined 14,881 data points per city to find what predicts political lean and turnout. The items below are a few correlations that stood out for Moclips, not a ranked or complete list of what matters most.
Areas with many never-married adults vote Democratic. About 51% of adults in Moclips have never been married, well above similar-sized cities (around 25%).
Cancer-screening access and voter turnout
Places with low colon-cancer-screening access tend to turn out at a lower rate; Moclips, WA sits in the bottom tenth nationally on this measure. Cancer screening does not drive turnout; it reflects income, insurance, and healthcare access.
Why turnout in Moclips looks the way it does
Renters vote less often than owners. About 47% of households in Moclips rent, about 22 points above the U.S. average of 25%. Limited routine healthcare access lines up with lower turnout, and Moclips sits in the bottom quarter on routine-care measures. High-crime urban areas turn out at lower rates, and Moclips sits in the top 15% on a violent-crime measure. Learn more about the findings and methodology on the political spectrum map.
Nearby Cities
- Pacific Beach, WA R+10
- Taholah, WA D+72
- Copalis Beach, WA R+16
- Copalis Crossing, WA R+25
- Humptulips, WA R+26
- Oyhut, WA R+31
- Newton, WA R+17
- New London, WA R+30
Cities with Similar Populations
- Silver Lake, MA R+5
- Edmund, WI D+12
- East Otis, MA D+6
- Coconut, FL R+37
- Elon, VA R+43
- Ventura, NM R+27
- Coal Run, OH R+60
- Bridgewater, VT D+13
- Erlin, OH R+49
- Owens, MO R+73
Sources and methodology
Precinct-level voting records used to fit the model come from Washington Secretary of State, Elections, distributed by the Voting and Election Science Team. Demographic inputs come from the U.S. Census Bureau (ACS 5-year estimates and the 2020 Decennial Census). Health and environmental inputs come from the CDC (PLACES and the Environmental Justice Index). Land cover comes from the USGS and EPA. Election-day and lead-up weather come from PRISM 4km daily grids and the NOAA Global Historical Climatology Network. Mail-voting and election-administration patterns come from the MIT Election Lab's Survey of the Performance of American Elections. Block-group crime detail comes from CrimeGrade. Internet data and modeling support provided by ISPreports.org.
Modeling and analysis by the BestNeighborhood data science team. Full methodology and findings: political spectrum map.
Methodology reviewed by the BestNeighborhood data team. Last updated May 2026.