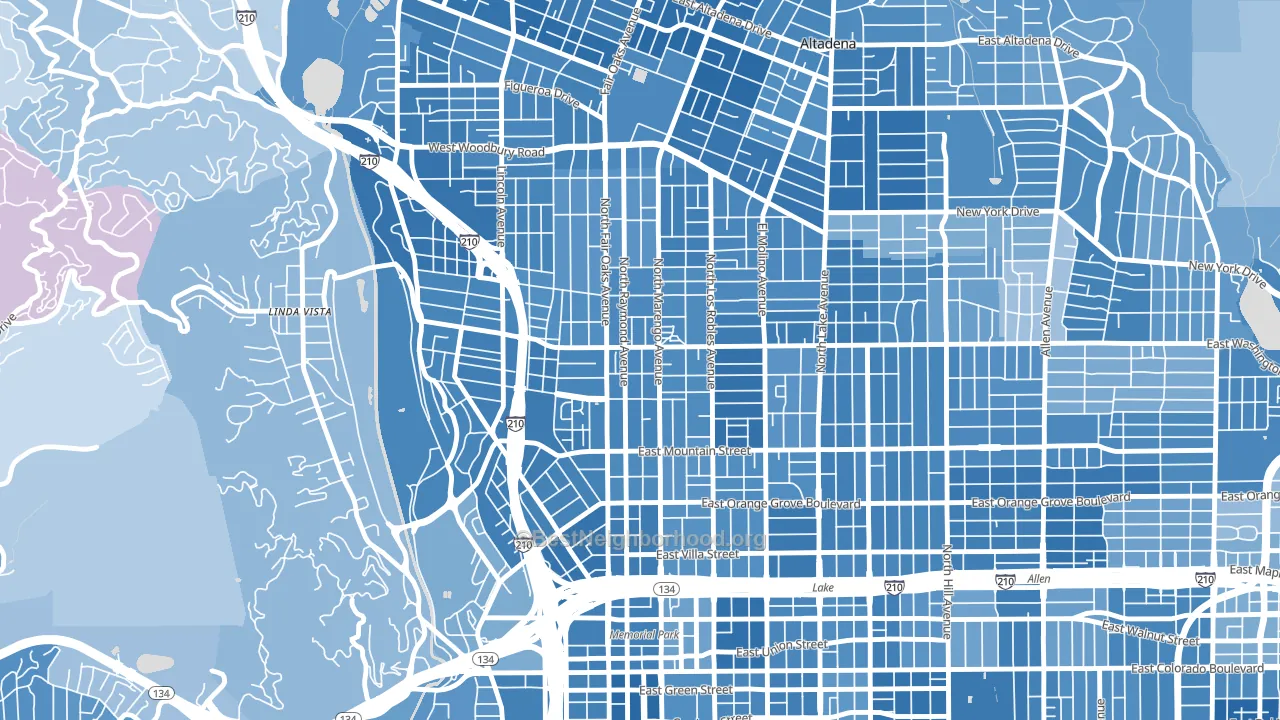
North Central is a Democratic stronghold. About 76% of voters here vote Democratic and 24% Republican.
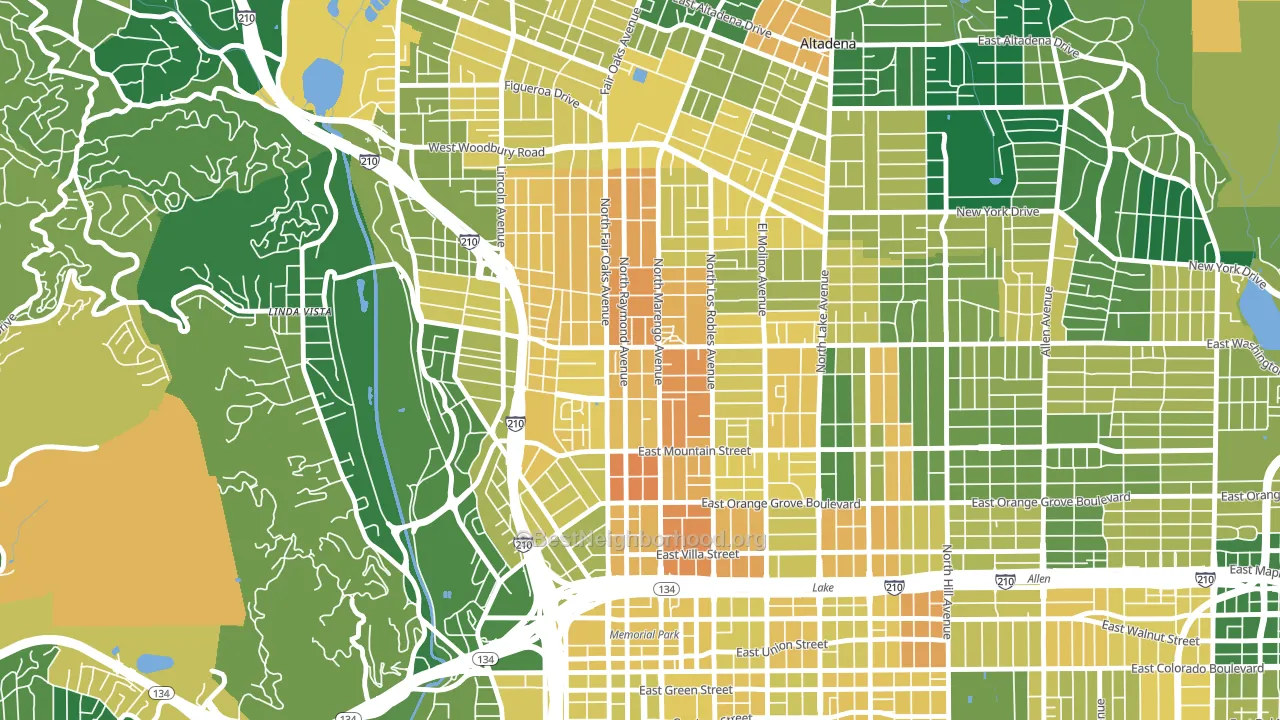
About 43% of adults in North Central typically vote, below the U.S. average of about 62%. Among adults in North Central, ~33% vote Democratic, ~10% Republican, and ~57% don't vote. The map below shows estimated turnout by block group.
How North Central compares
Among neighborhoods within 5 miles, North Central leans more Democratic than 8 of 14 neighbors.
North Central runs about 31 points more Democratic than California as a whole.
Politics vary noticeably by block within North Central. The northeast side is the most Democratic-leaning (D+57) and the south side is the least Democratic-leaning (D+47), a spread of about 10 points.
Why North Central leans the way it does
This analysis examined 14,881 data points per neighborhood to find what predicts political lean and turnout. The items below are a few correlations that stood out for North Central, not a ranked or complete list of what matters most.
Dense areas vote Democratic. More than 99% of residents in North Central live in densely developed areas, about 64 points above the U.S. average of 36%. A high never-married share predicts Democratic voting, and about 52% of adults in North Central have never been married, above 84% of neighborhoods.
Cancer-screening access and voter turnout
Places with low colon-cancer-screening access tend to turn out at a lower rate; North Central, Pasadena, CA sits in the bottom tenth nationally on this measure. Cancer screening does not drive turnout; it reflects income, insurance, and healthcare access.
Why turnout in North Central looks the way it does
Areas with limited routine healthcare access turn out at lower rates. North Central is in the bottom quarter nationally for routine-care measures such as insurance coverage, preventive screenings, and dental visits. Crowded housing lines up with lower turnout, and about 15% of homes in North Central have more than one occupant per room, above 96% of neighborhoods. Learn more about the findings and methodology on the political spectrum map.
Nearby Neighborhoods
- Normandie Heights, Pasadena, CA D+55
- North Arroyo, Pasadena, CA D+41
- West Central, Pasadena, CA D+54
- Madison Heights, Pasadena, CA D+65
- South Arroyo, Pasadena, CA D+55
- East Central, Pasadena, CA D+42
- Mid Central, Pasadena, CA D+51
- South East, Pasadena, CA D+56
- Chevy Chase, Glendale, CA D+3
- North East, Pasadena, CA D+24
Neighborhoods with Similar Populations
- Ramona, Riverside, CA D+7
- Point Breeze-Philadelphia, Philadelphia, PA D+73
- Flint Village, Fall River, MA Even
- Oxon Hill-Glassmanor, Oxon Hill, MD D+79
- Metro West, Orlando, FL D+20
- Shadow Creek Ranch, Pearland, TX D+33
- Weequahic, Newark, NJ D+81
- Northwest Austin, Austin, TX D+25
- Springfield Gardens, Queens, NY D+78
- UC Irvine, Irvine, CA D+70
Sources and methodology
Precinct-level voting records used to fit the model come from California Secretary of State, Elections, distributed by the Voting and Election Science Team. Demographic inputs come from the U.S. Census Bureau (ACS 5-year estimates and the 2020 Decennial Census). Health and environmental inputs come from the CDC (PLACES and the Environmental Justice Index). Land cover comes from the USGS and EPA. Election-day and lead-up weather come from PRISM 4km daily grids and the NOAA Global Historical Climatology Network. Mail-voting and election-administration patterns come from the MIT Election Lab's Survey of the Performance of American Elections. Block-group crime detail comes from CrimeGrade. Internet data and modeling support provided by ISPreports.org.
Modeling and analysis by the BestNeighborhood data science team. Full methodology and findings: political spectrum map.
Methodology reviewed by the BestNeighborhood data team. Last updated May 2026.