Orbisonia is a Republican stronghold. About 17% of voters here vote Democratic and 83% Republican.
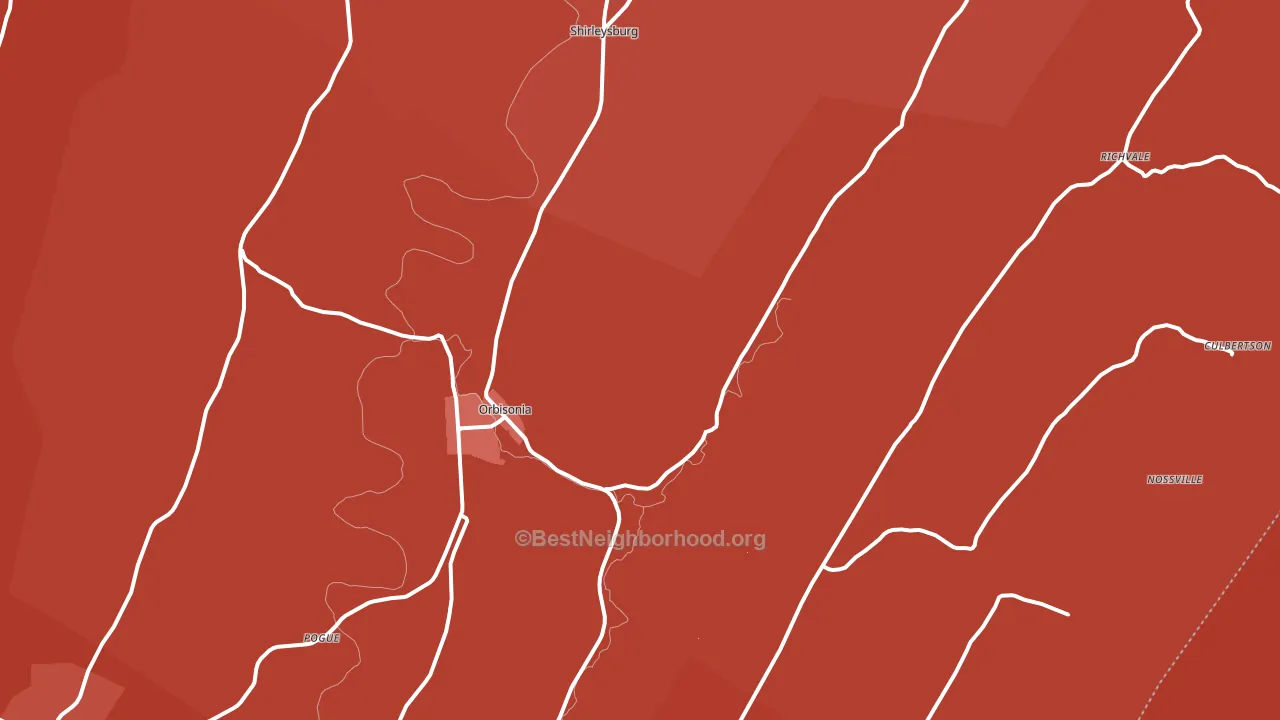
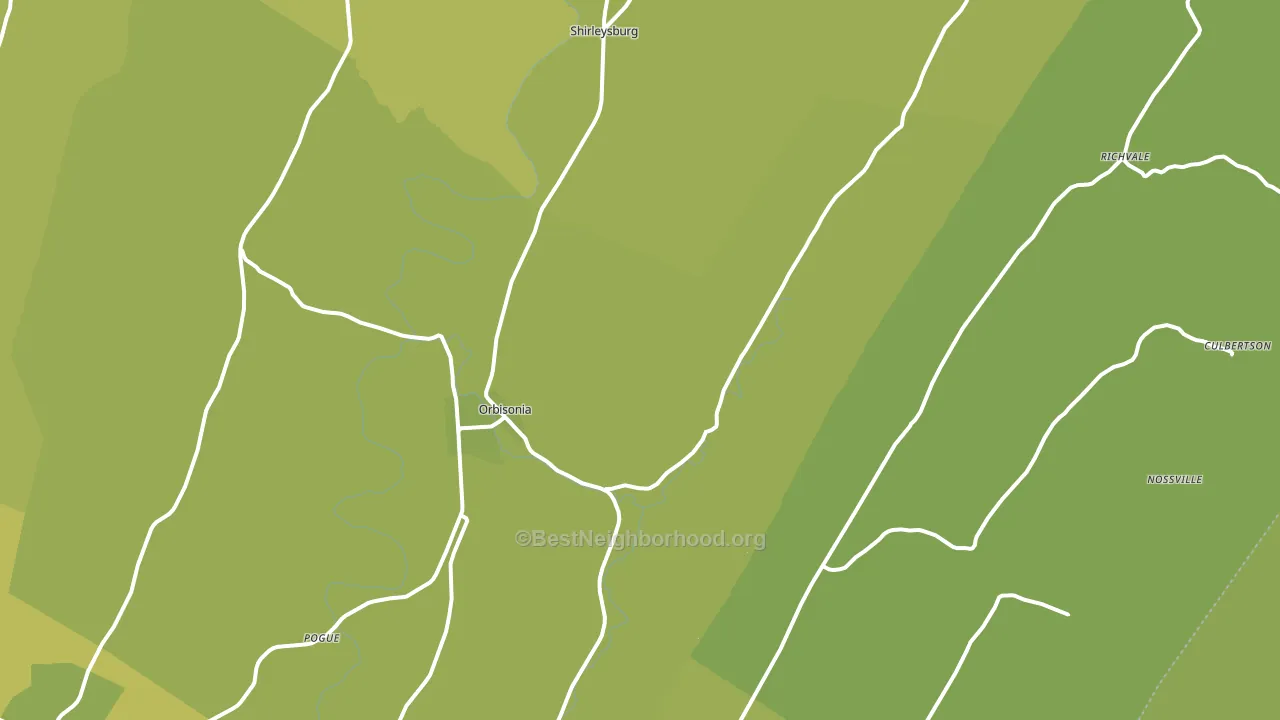
About 73% of adults in Orbisonia typically vote, above the U.S. average of about 62%. Among adults in Orbisonia, ~12% vote Democratic, ~61% Republican, and ~27% don't vote. The map below shows estimated turnout by block group.
How Orbisonia compares
Among cities within 25 miles, Orbisonia leans more Republican than 42 of 120 neighbors.
Orbisonia runs about 64 points more Republican than Pennsylvania as a whole.
Politics vary noticeably by neighborhood within Orbisonia. The southwest side is the most Republican-leaning (R+74) and the west side is the least Republican-leaning (R+60), a spread of about 14 points.
Why Orbisonia leans the way it does
This analysis examined 14,881 data points per city to find what predicts political lean and turnout. The items below are a few correlations that stood out for Orbisonia, not a ranked or complete list of what matters most.
Areas with a high white share and below-average college attainment vote Republican. In Orbisonia, about 98% of residents are non-Hispanic white, about 25 points above the U.S. average of 72%; about 16% of adults hold a bachelor's degree, about 10 points below the Pennsylvania average of 26%. Dense places usually vote Democratic, but Orbisonia runs against that pattern.
Paved land cover and Democratic lean
Places with extensive paved surfaces tend to lean Democratic; Orbisonia, PA sits in the top quarter nationally on this measure. Paved ground does not change how people vote; it mostly reflects how urban and built-up a place is.
Why turnout in Orbisonia looks the way it does
Turnout in Orbisonia sits close to the national pattern. Learn more about the findings and methodology on the political spectrum map.
Nearby Cities
- Rockhill Furnace, PA R+74
- Rockhill, PA R+60
- Shirleysburg, PA R+69
- Pogue, PA R+74
- Blairs Mills, PA R+68
- Aughwick, PA R+66
- Neelyton, PA R+70
- Three Springs, PA R+72
- Mapleton Depot, PA R+70
Cities with Similar Populations
- Cowden, IL R+64
- Mount Nebo, WV R+62
- Row, OK R+60
- Little Birch, WV R+58
- Spring Grove, VA R+8
- Hoosick, NY R+29
- Homer, NE R+53
- Mount Zion, VA R+41
- Johns, MS R+69
- Johnson Corner, GA R+72
Sources and methodology
Precinct-level voting records used to fit the model come from Pennsylvania Department of State, Bureau of Elections, distributed by the Voting and Election Science Team. Demographic inputs come from the U.S. Census Bureau (ACS 5-year estimates and the 2020 Decennial Census). Health and environmental inputs come from the CDC (PLACES and the Environmental Justice Index). Land cover comes from the USGS and EPA. Election-day and lead-up weather come from PRISM 4km daily grids and the NOAA Global Historical Climatology Network. Mail-voting and election-administration patterns come from the MIT Election Lab's Survey of the Performance of American Elections. Block-group crime detail comes from CrimeGrade. Internet data and modeling support provided by ISPreports.org.
Modeling and analysis by the BestNeighborhood data science team. Full methodology and findings: political spectrum map.
Methodology reviewed by the BestNeighborhood data team. Last updated May 2026.