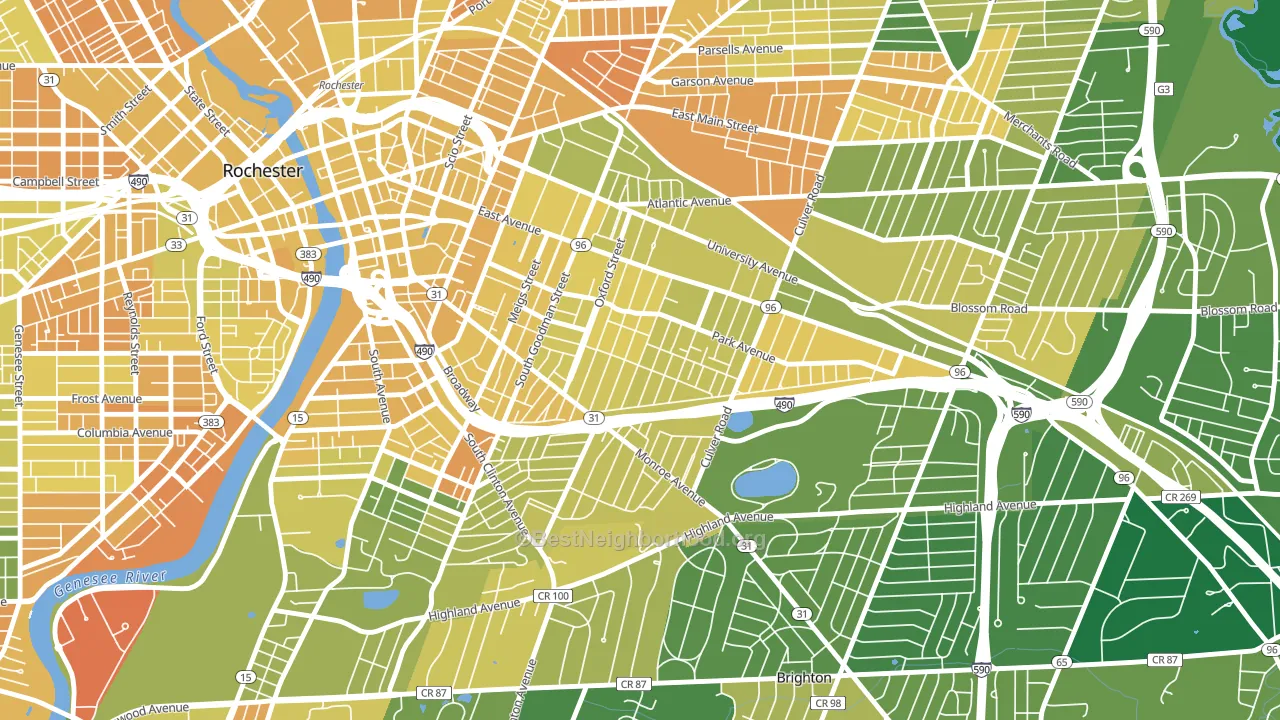
Park Avenue is a Democratic stronghold. About 81% of voters here vote Democratic and 19% Republican.
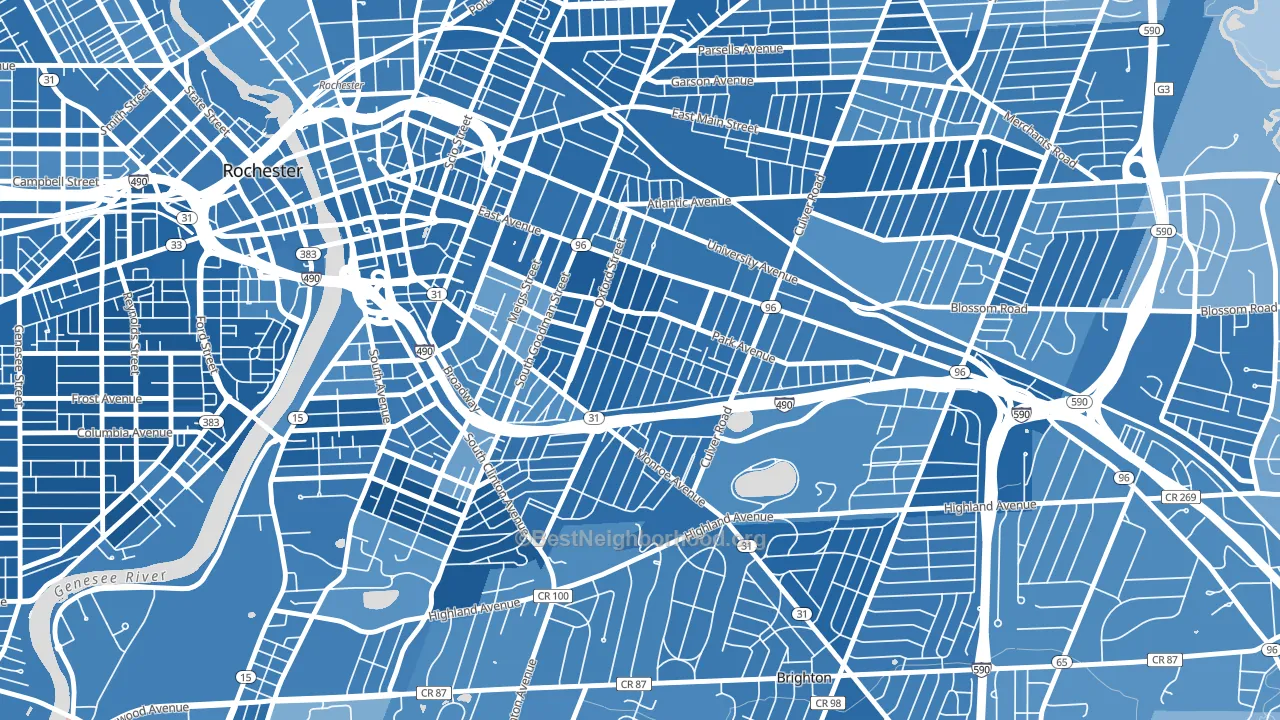
About 54% of adults in Park Avenue typically vote, below the U.S. average of about 62%. Among adults in Park Avenue, ~44% vote Democratic, ~10% Republican, and ~46% don't vote. The map below shows estimated turnout by block group.
How Park Avenue compares
Among neighborhoods within 5 miles, Park Avenue leans more Democratic than 17 of 27 neighbors.
Park Avenue runs about 50 points more Democratic than New York as a whole.
Why Park Avenue leans the way it does
This analysis examined 14,881 data points per neighborhood to find what predicts political lean and turnout. The items below are a few correlations that stood out for Park Avenue, not a ranked or complete list of what matters most.
Dense areas vote Democratic. More than 99% of residents in Park Avenue live in densely developed areas, about 64 points above the U.S. average of 36%. High college attainment predicts Democratic voting, and Park Avenue sits in the top quarter (about 64%, above 85% of neighborhoods). A high never-married share predicts Democratic voting, and about 65% of adults in Park Avenue have never been married, above 96% of neighborhoods.
Never-married share, developed land, and voter turnout
Places that combine a never-married-heavy adult population and a heavily developed built environment tend to turn out at a lower rate, as Park Avenue, Rochester, NY does.
Why turnout in Park Avenue looks the way it does
Renters vote less often than owners. About 79% of households in Park Avenue rent, about 54 points above the U.S. average of 25%. Strong routine healthcare access lines up with higher turnout, and Park Avenue sits in the top quarter on routine-care measures. Learn more about the findings and methodology on the political spectrum map.
Nearby Neighborhoods
- East Avenue, Rochester, NY D+64
- Pearl-Meigs-Monroe, Rochester, NY D+61
- Ellwanger-Barry, Rochester, NY D+68
- South Wedge, Rochester, NY D+70
- Cobbs Hill, Rochester, NY D+59
- Roselawn, Brighton, NY D+61
- South Marketview Heights, Rochester, NY D+70
- Beechwood, Rochester, NY D+70
- Central Business District-Rochester, Rochester, NY D+64
- Corn Hill, Rochester, NY D+62
Neighborhoods with Similar Populations
- University Park, Irvine, CA D+16
- North Omaha, Omaha, NE D+41
- The Vistas, Las Vegas, NV Even
- Jordan Heights, Allentown, PA D+36
- Bayless Atkins, Lubbock, TX R+9
- West Phoenix, Phoenix, AZ D+32
- Mount Hope, San Diego, CA D+35
- Walnut Hills, Cincinnati, OH D+74
- Ukrainian Village, Parma, OH Even
- Franklin Randolph, Boise, ID Even
Sources and methodology
Precinct-level voting records used to fit the model come from New York State Board of Elections, distributed by the Voting and Election Science Team. Demographic inputs come from the U.S. Census Bureau (ACS 5-year estimates and the 2020 Decennial Census). Health and environmental inputs come from the CDC (PLACES and the Environmental Justice Index). Land cover comes from the USGS and EPA. Election-day and lead-up weather come from PRISM 4km daily grids and the NOAA Global Historical Climatology Network. Mail-voting and election-administration patterns come from the MIT Election Lab's Survey of the Performance of American Elections. Block-group crime detail comes from CrimeGrade. Internet data and modeling support provided by ISPreports.org.
Modeling and analysis by the BestNeighborhood data science team. Full methodology and findings: political spectrum map.
Methodology reviewed by the BestNeighborhood data team. Last updated May 2026.