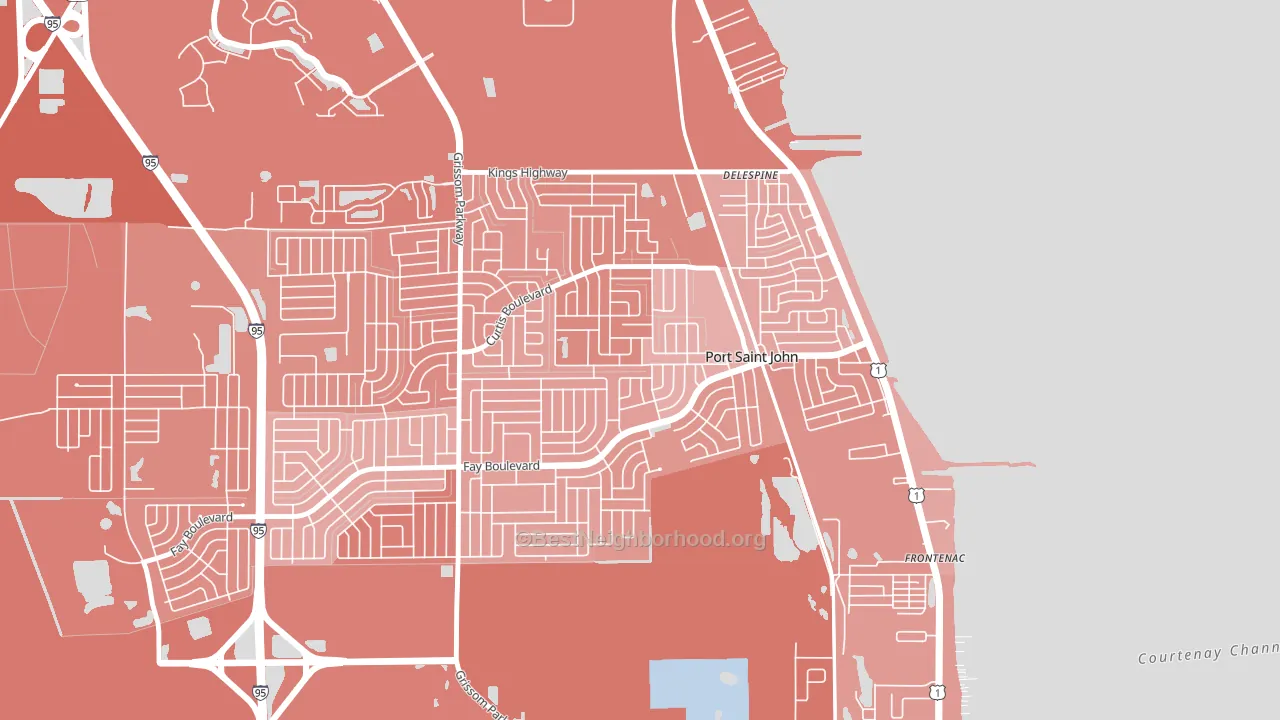
Port St. John leans heavily Republican by roughly 32 points: about 34% of voters vote Democratic and 66% Republican.
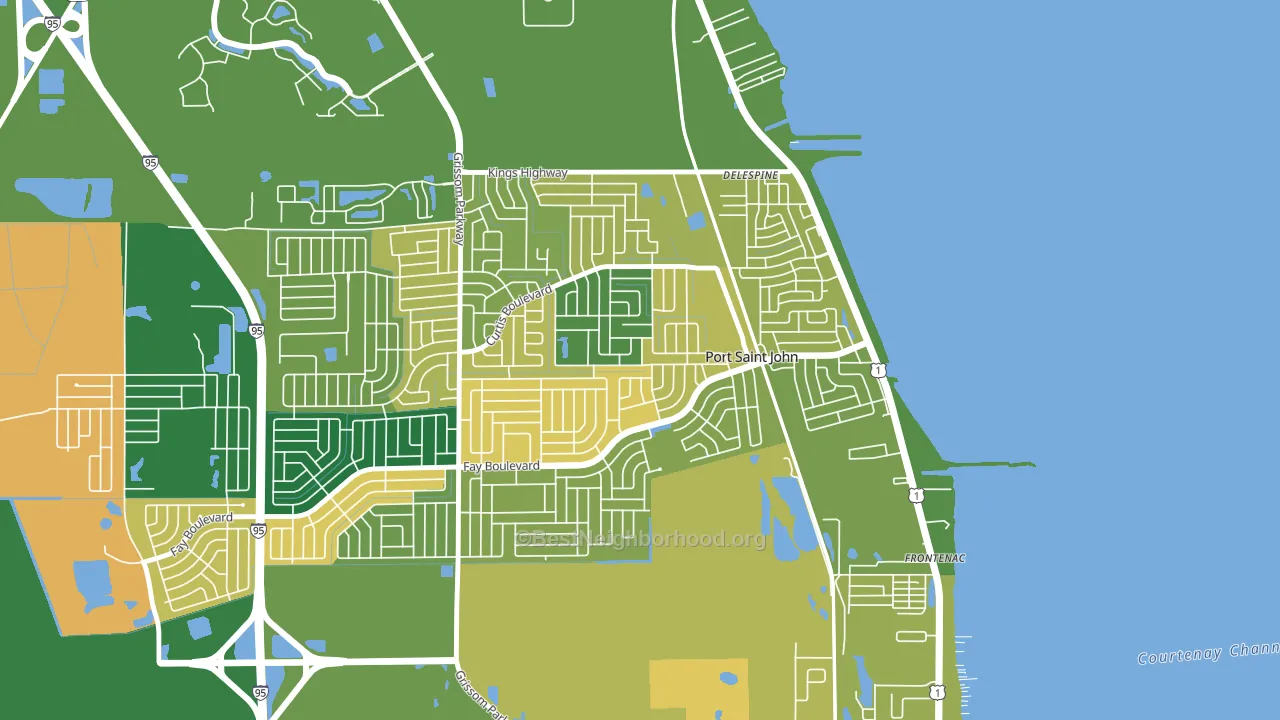
About 68% of adults in Port St. John typically vote, above the U.S. average of about 62%. Among adults in Port St. John, ~23% vote Democratic, ~45% Republican, and ~32% don't vote. The map below shows estimated turnout by block group.
How Port St. John compares
Among cities within 25 miles, Port St. John leans more Republican than 13 of 17 neighbors.
Port St. John runs about 18 points more Republican than Florida as a whole.
Politics vary noticeably by neighborhood within Port St. John. The northwest side is the most Republican-leaning (R+37) and the east side is the least Republican-leaning (R+21), a spread of about 15 points.
Why Port St. John leans the way it does
This analysis examined 14,881 data points per city to find what predicts political lean and turnout. The items below are a few correlations that stood out for Port St. John, not a ranked or complete list of what matters most.
Port St. John votes Republican even though it is densely developed (about 92%, far above the Florida average of 57%). State and regional patterns outweigh the Democratic lean that density usually predicts here.
Walkability and Democratic lean
Places with a highly walkable street grid tend to lean Democratic; Port St. John, FL sits in the top quarter nationally on this measure. A walkable street grid does not change how people vote; it mostly reflects how urban a place is.
Why turnout in Port St. John looks the way it does
Homeowners vote more often than renters. About 93% of households in Port St. John own their home, about 22 points above the Florida average of 71%. Limited routine healthcare access lines up with lower turnout, and Port St. John sits in the bottom quarter on routine-care measures. Learn more about the findings and methodology on the political spectrum map.
Nearby Cities
- Cocoa, FL R+19
- Bellwood, FL R+46
- Cocoa West, FL D+22
- Titusville, FL R+23
- Merritt Island, FL R+27
- Christmas, FL R+44
- Cape Canaveral, FL R+18
- Rockledge, FL R+17
- Cocoa Beach, FL R+21
- Mims, FL R+42
Cities with Similar Populations
- Lumberton, NJ D+19
- Alma, AR R+59
- Rock Falls, IL R+16
- Sweetwater, TN R+63
- Eaton Rapids, MI R+27
- Globe, AZ R+33
- Accokeek, MD D+69
- Midway City, CA R+8
- Rehoboth, MA R+10
- Salisbury, NY R+14
Sources and methodology
Precinct-level voting records used to fit the model come from Florida Division of Elections, distributed by the Voting and Election Science Team. Demographic inputs come from the U.S. Census Bureau (ACS 5-year estimates and the 2020 Decennial Census). Health and environmental inputs come from the CDC (PLACES and the Environmental Justice Index). Land cover comes from the USGS and EPA. Election-day and lead-up weather come from PRISM 4km daily grids and the NOAA Global Historical Climatology Network. Mail-voting and election-administration patterns come from the MIT Election Lab's Survey of the Performance of American Elections. Block-group crime detail comes from CrimeGrade. Internet data and modeling support provided by ISPreports.org.
Modeling and analysis by the BestNeighborhood data science team. Full methodology and findings: political spectrum map.
Methodology reviewed by the BestNeighborhood data team. Last updated May 2026.