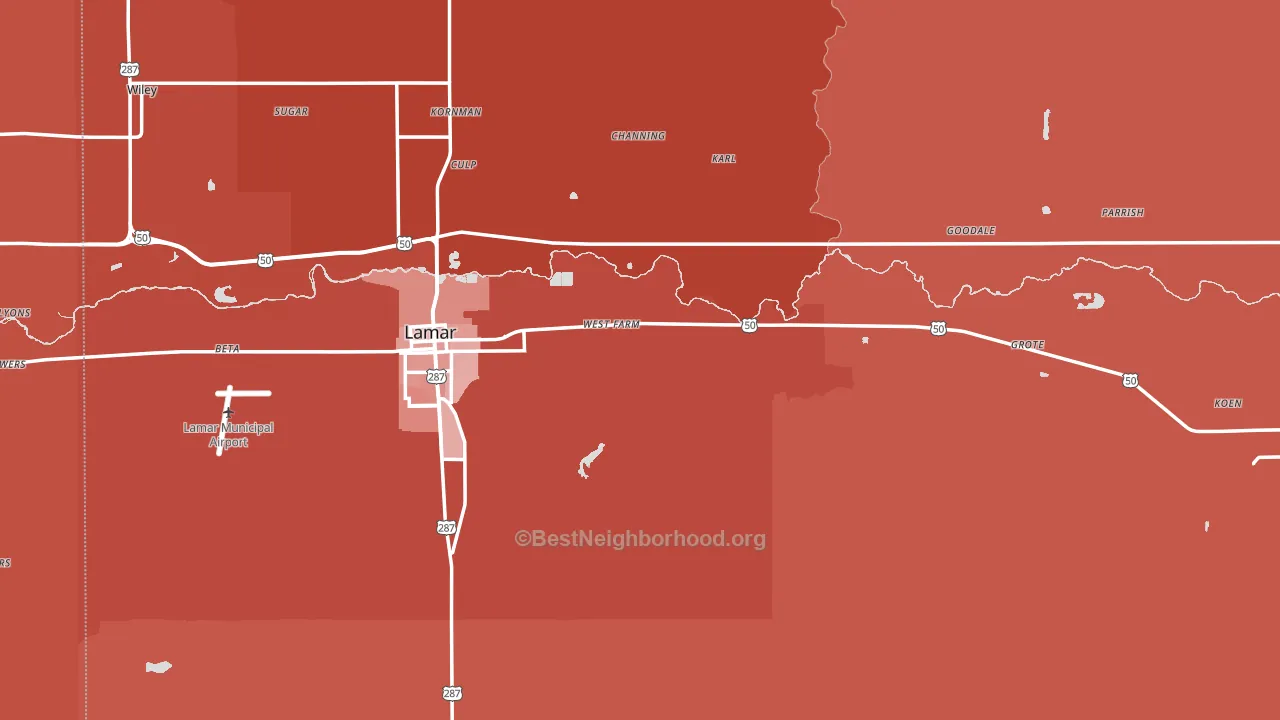
Prowers County leans heavily Republican by roughly 38 points: about 31% of voters vote Democratic and 69% Republican.
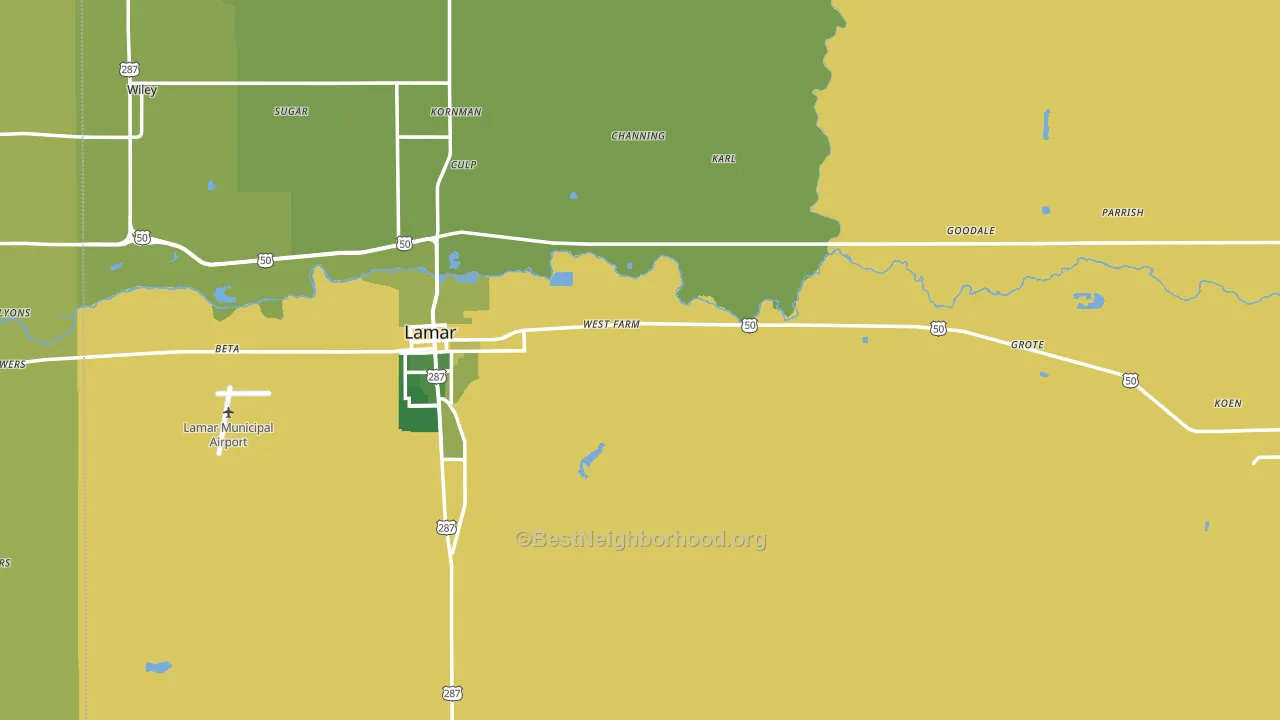
About 74% of adults in Prowers County typically vote, above the U.S. average of about 62%. Among adults in Prowers County, ~23% vote Democratic, ~51% Republican, and ~26% don't vote. The map below shows estimated turnout by block group.
How Prowers County compares
Among counties within 50 miles, Prowers County leans more Republican than 1 of 4 neighbors.
Prowers County runs about 49 points more Republican than Colorado as a whole. Colorado leans Democratic overall, while Prowers County is one of the few Republican-leaning pockets.
Politics vary noticeably by city within Prowers County. The north side is the most Republican-leaning (R+65) and the west side is the least Republican-leaning (R+25), a spread of about 40 points.
Why Prowers County leans the way it does
This analysis examined 14,881 data points per county to find what predicts political lean and turnout. The items below are a few correlations that stood out for Prowers County, not a ranked or complete list of what matters most.
Car-dependent areas vote Republican. About 83% of residents in Prowers County drive to work alone, about 9 points above the U.S. average of 74%. Prowers County runs against the grain of Colorado, a Republican-leaning pocket in a Democratic-leaning state.
Local retail density and voter turnout
Places with dense local retail within a mile tend to turn out at a higher rate; Prowers County, CO sits in the top tenth nationally on this measure. Nearby retail does not change how people vote; it reflects how urban and built-up a place is.
Why turnout in Prowers County looks the way it does
Areas with limited routine healthcare access turn out at lower rates. Prowers County is in the bottom quarter nationally for routine-care measures such as insurance coverage, preventive screenings, and dental visits. Learn more about the findings and methodology on the political spectrum map.
Nearby Counties
- Kiowa County, CO R+72
- Bent County, CO R+29
- Hamilton County, KS R+71
- Baca County, CO R+69
- Cheyenne County, CO R+72
- Greeley County, KS R+68
- Stanton County, KS R+48
- Otero County, CO R+23
- Wallace County, KS R+83
- Wichita County, KS R+59
Counties with Similar Populations
- Chickasaw County, IA R+40
- Greene County, IL R+56
- Lawrence County, MS R+30
- Morris County, TX R+39
- Little River County, AR R+45
- Washington County, KY R+58
- Skamania County, WA R+13
- Summers County, WV R+52
- Boundary County, ID R+64
- Koochiching County, MN R+26
Sources and methodology
Precinct-level voting records used to fit the model come from Colorado Secretary of State, Elections, distributed by the Voting and Election Science Team. Demographic inputs come from the U.S. Census Bureau (ACS 5-year estimates and the 2020 Decennial Census). Health and environmental inputs come from the CDC (PLACES and the Environmental Justice Index). Land cover comes from the USGS and EPA. Election-day and lead-up weather come from PRISM 4km daily grids and the NOAA Global Historical Climatology Network. Mail-voting and election-administration patterns come from the MIT Election Lab's Survey of the Performance of American Elections. Block-group crime detail comes from CrimeGrade. Internet data and modeling support provided by ISPreports.org.
Modeling and analysis by the BestNeighborhood data science team. Full methodology and findings: political spectrum map.
Methodology reviewed by the BestNeighborhood data team. Last updated May 2026.