Santa Rita leans Republican by roughly 24 points: about 38% of voters vote Democratic and 62% Republican.
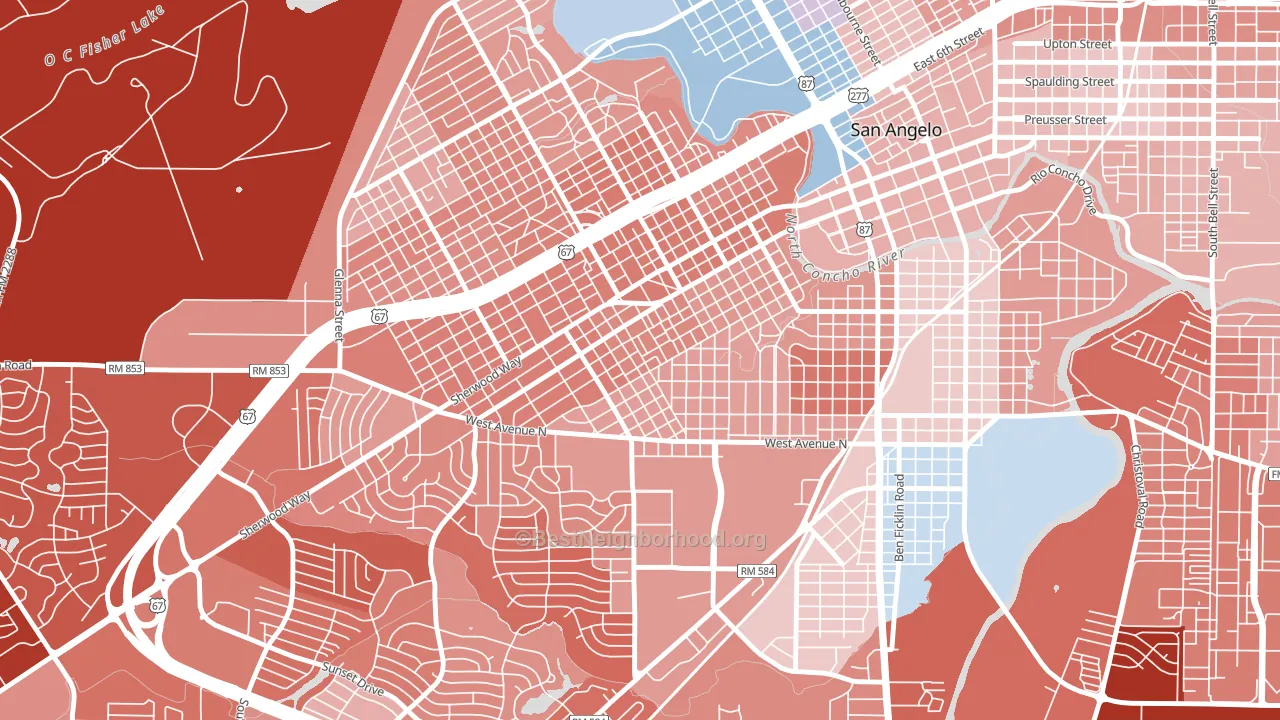
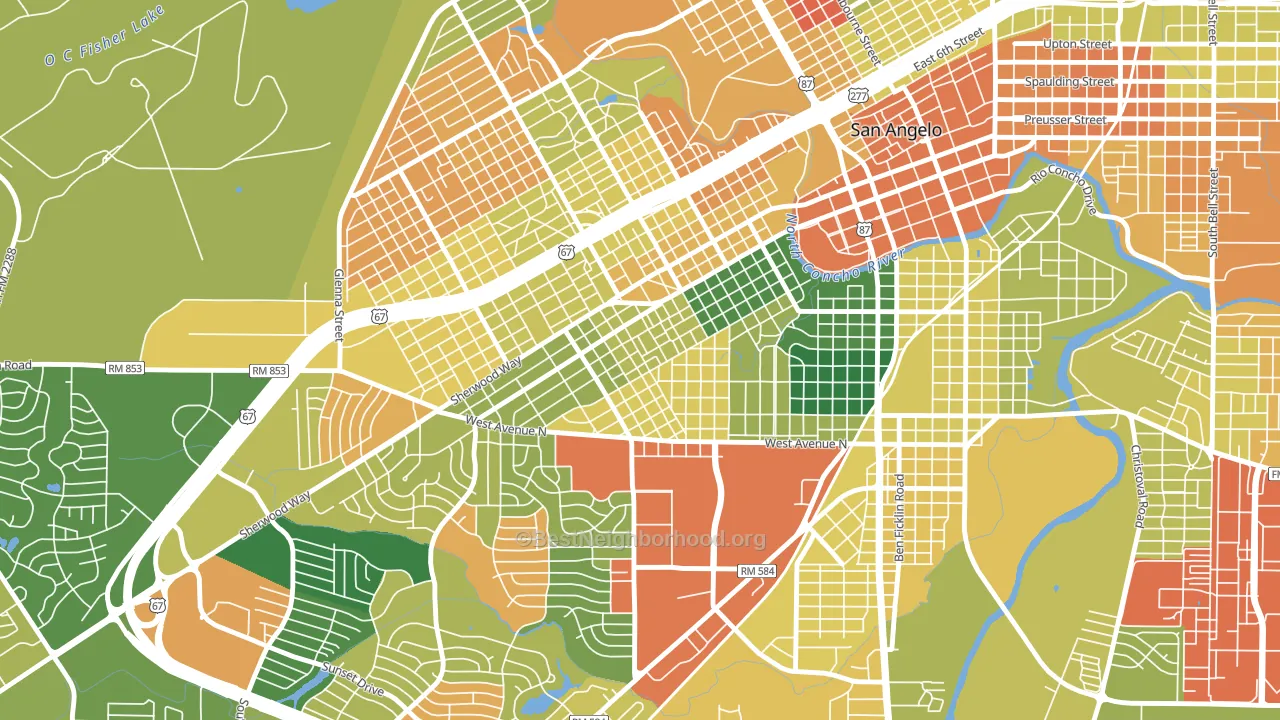
About 64% of adults in Santa Rita typically vote, near the U.S. average of about 62%. Among adults in Santa Rita, ~24% vote Democratic, ~40% Republican, and ~36% don't vote. The map below shows estimated turnout by block group.
How Santa Rita compares
Among neighborhoods within 5 miles, Santa Rita leans more Republican than 3 of 8 neighbors.
Santa Rita runs about 11 points more Republican than Texas as a whole.
Why Santa Rita leans the way it does
Density, race composition, education, and family structure all sit close to their national averages in Santa Rita. The lean here lands roughly where demographic data alone would predict.
Never-married share and voter turnout
Places with a low never-married share tend to turn out at a higher rate; Santa Rita, San Angelo, TX sits below the national average on this measure.
Why turnout in Santa Rita looks the way it does
Turnout in Santa Rita sits close to the national pattern. Routine healthcare access, homeownership, education, and food security all land near their national averages here. Learn more about the findings and methodology on the political spectrum map.
Nearby Neighborhoods
- Central, San Angelo, TX R+30
- College Hills, San Angelo, TX R+29
- Angelo Heights, San Angelo, TX R+22
- Fort Concho, San Angelo, TX R+14
- Reagan, San Angelo, TX R+20
- Southland, San Angelo, TX R+43
- Bonham, San Angelo, TX R+34
- Belaire, San Angelo, TX R+42
- Far Southside, Abilene, TX R+53
- Chimney Rock Area, Abilene, TX R+46
Neighborhoods with Similar Populations
- Woods Park, Lincoln, NE D+37
- Seven Oaks at Grand Island, Bakersfield, CA R+22
- The Dominion, San Antonio, TX R+15
- Washington Square, Santa Ana, CA D+24
- Fairview, Milwaukee, WI D+6
- Orange Blossom Gardens, Lady Lake, FL R+24
- Marshall-Shadeland, Pittsburgh, PA D+56
- Lyon Village, Arlington, VA D+63
- Perimeter Center, Sandy Springs, GA D+33
- Cactus Gale, Glendale, AZ R+11
Sources and methodology
Precinct-level voting records used to fit the model come from Texas Secretary of State, Elections Division, distributed by the Voting and Election Science Team. Demographic inputs come from the U.S. Census Bureau (ACS 5-year estimates and the 2020 Decennial Census). Health and environmental inputs come from the CDC (PLACES and the Environmental Justice Index). Land cover comes from the USGS and EPA. Election-day and lead-up weather come from PRISM 4km daily grids and the NOAA Global Historical Climatology Network. Mail-voting and election-administration patterns come from the MIT Election Lab's Survey of the Performance of American Elections. Block-group crime detail comes from CrimeGrade. Internet data and modeling support provided by ISPreports.org.
Modeling and analysis by the BestNeighborhood data science team. Full methodology and findings: political spectrum map.
Methodology reviewed by the BestNeighborhood data team. Last updated May 2026.