Lyon Village is a Democratic stronghold. About 81% of voters here vote Democratic and 19% Republican.
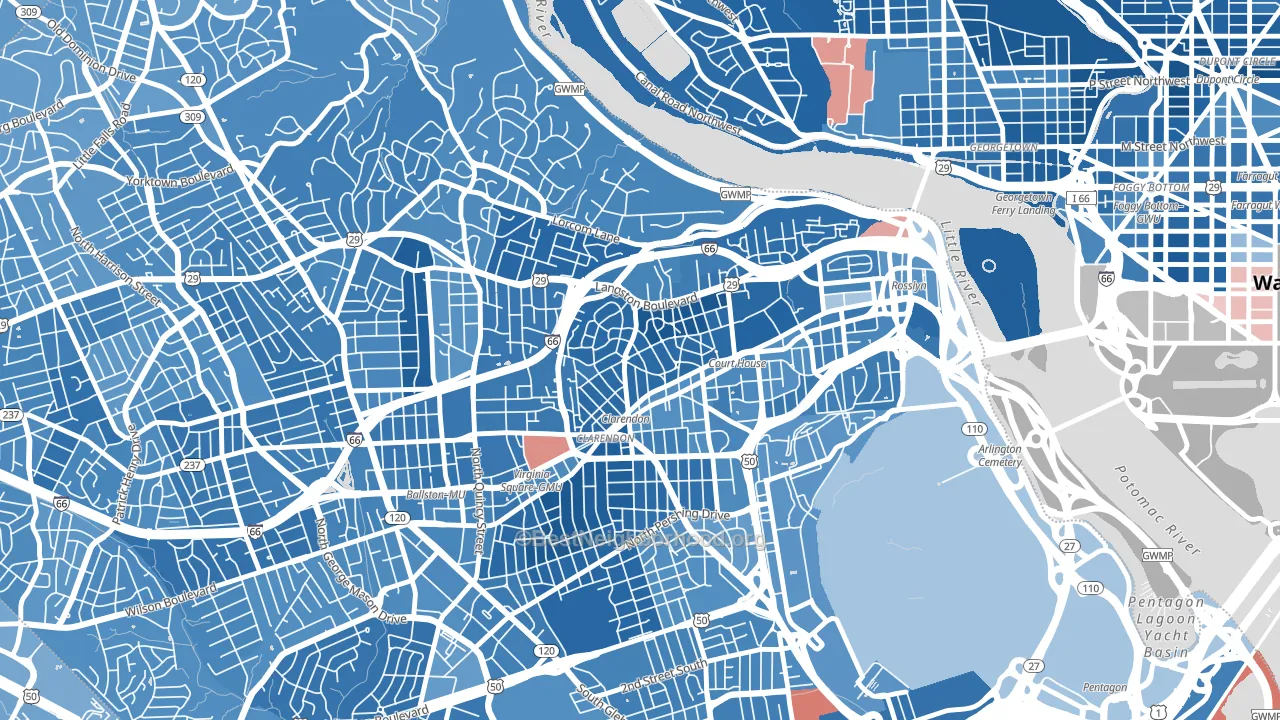
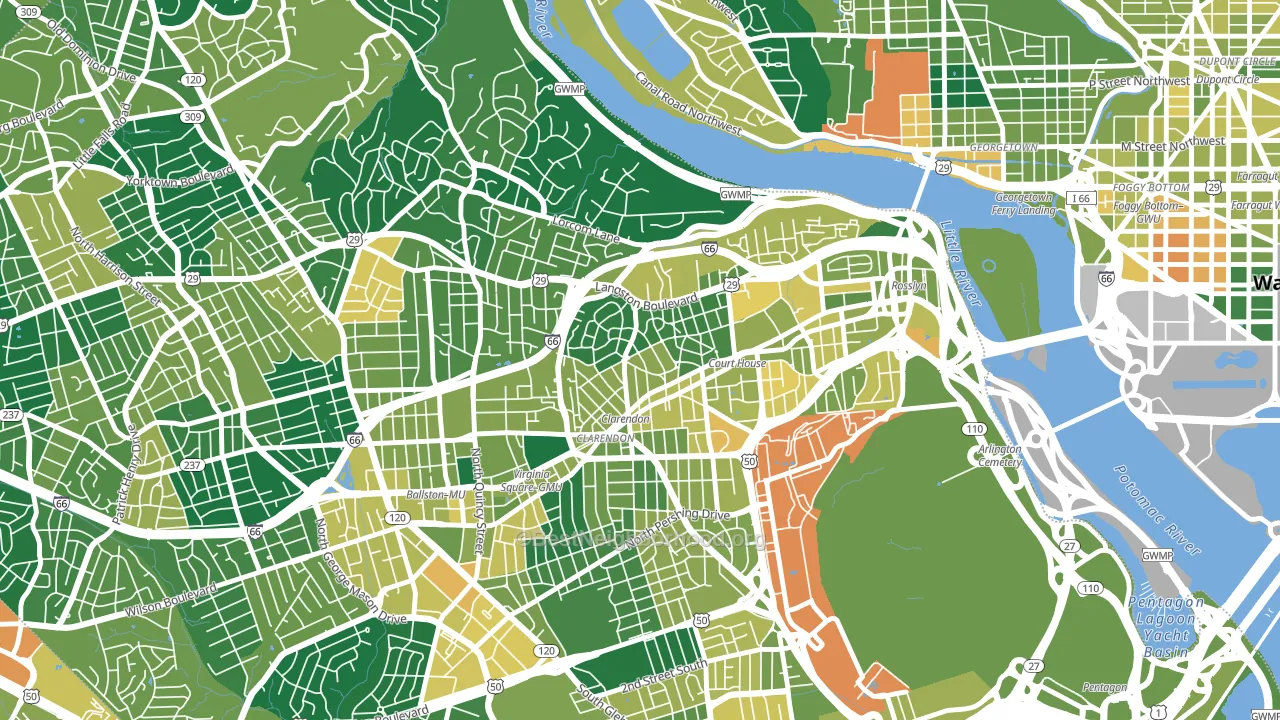
About 82% of adults in Lyon Village typically vote, above the U.S. average of about 62%. Among adults in Lyon Village, ~67% vote Democratic, ~15% Republican, and ~18% don't vote. The map below shows estimated turnout by block group.
How Lyon Village compares
Among neighborhoods within 5 miles, Lyon Village leans more Democratic than 32 of 53 neighbors.
Lyon Village runs about 57 points more Democratic than Virginia as a whole.
Why Lyon Village leans the way it does
This analysis examined 14,881 data points per neighborhood to find what predicts political lean and turnout. The items below are a few correlations that stood out for Lyon Village, not a ranked or complete list of what matters most.
Areas with high college attainment vote Democratic. About 88% of adults in Lyon Village hold a bachelor's degree, about 60 points above the U.S. average of 28%. Dense areas vote Democratic, and Lyon Village sits in the top fifth on density (more than 99%, above 89% of neighborhoods).
Walkability and Democratic lean
Places with a highly walkable street grid tend to lean Democratic; Lyon Village, Arlington, VA sits in the top quarter nationally on this measure. A walkable street grid does not change how people vote; it mostly reflects how urban a place is.
Why turnout in Lyon Village looks the way it does
Areas with strong routine healthcare access turn out at higher rates. Lyon Village is in the top quarter nationally for routine-care measures such as insurance coverage, preventive screenings, and dental visits. The dental-visit rate here is about 79%, about 19 points above the U.S. average of 60%. High high-school completion lines up with higher turnout, and more than 99% of adults in Lyon Village have completed high school, above 93% of neighborhoods. Learn more about the findings and methodology on the political spectrum map.
Nearby Neighborhoods
- Clarendon, Arlington, VA D+60
- North Highland, Arlington, VA D+63
- Lyon Park, Arlington, VA D+56
- Cherrydale, Arlington, VA D+57
- Radnor-Ft Myer Heights, Arlington, VA D+56
- Ballston-Virginia Square, Arlington, VA D+58
- Ashton Heights, Arlington, VA D+62
- North Rosslyn, Arlington, VA D+57
- Waverly Hills, Arlington, VA D+49
- Donaldson Run, Arlington, VA D+57
Neighborhoods with Similar Populations
- Perimeter Center, Sandy Springs, GA D+33
- Seven Oaks at Grand Island, Bakersfield, CA R+22
- Central Business District, Worcester, MA D+42
- Santa Rita, San Angelo, TX R+25
- Woods Park, Lincoln, NE D+37
- Arlington, Youngstown, OH D+44
- Washington Square, Santa Ana, CA D+24
- The Dominion, San Antonio, TX R+15
- Emerald Estates, Bakersfield, CA R+42
- Fairview, Milwaukee, WI D+6
Sources and methodology
Precinct-level voting records used to fit the model come from Virginia Department of Elections, distributed by the Voting and Election Science Team. Demographic inputs come from the U.S. Census Bureau (ACS 5-year estimates and the 2020 Decennial Census). Health and environmental inputs come from the CDC (PLACES and the Environmental Justice Index). Land cover comes from the USGS and EPA. Election-day and lead-up weather come from PRISM 4km daily grids and the NOAA Global Historical Climatology Network. Mail-voting and election-administration patterns come from the MIT Election Lab's Survey of the Performance of American Elections. Block-group crime detail comes from CrimeGrade. Internet data and modeling support provided by ISPreports.org.
Modeling and analysis by the BestNeighborhood data science team. Full methodology and findings: political spectrum map.
Methodology reviewed by the BestNeighborhood data team. Last updated May 2026.