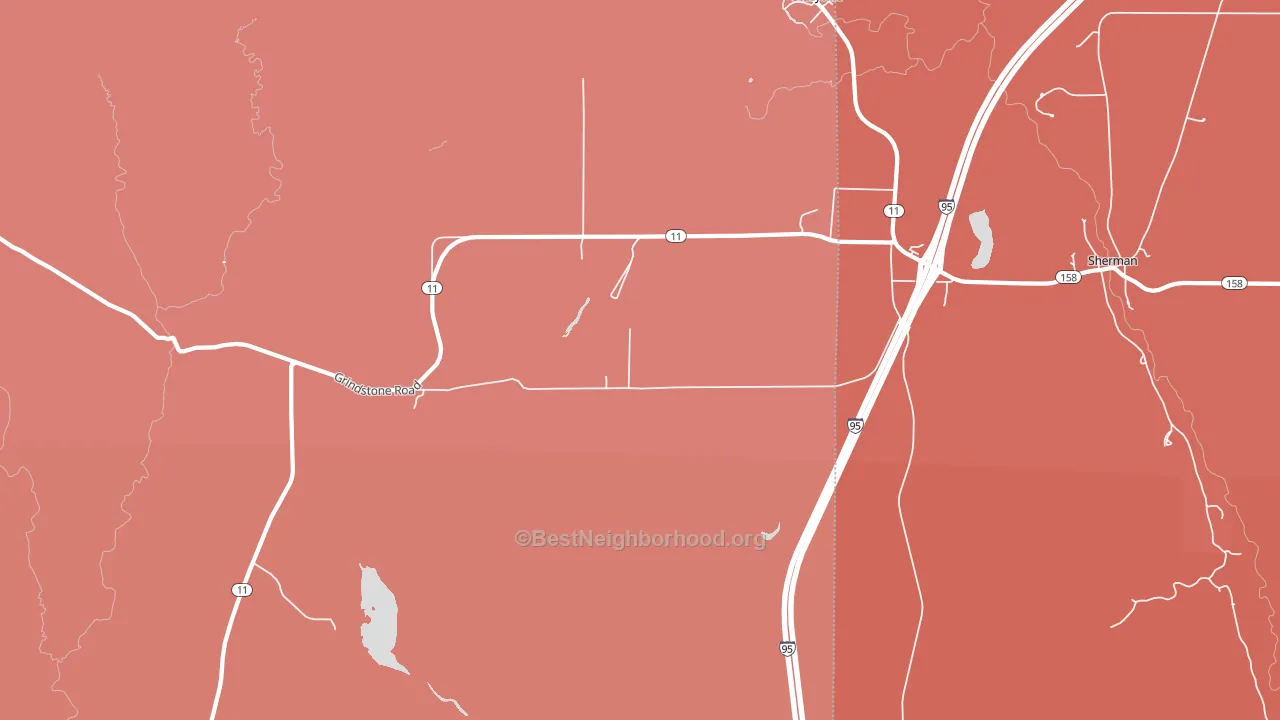
Sherman leans heavily Republican by roughly 36 points: about 32% of voters vote Democratic and 68% Republican. These figures are model estimates: Maine did not have precinct-level voting records available for training, so the numbers above come from demographic and health features rather than local ground truth.
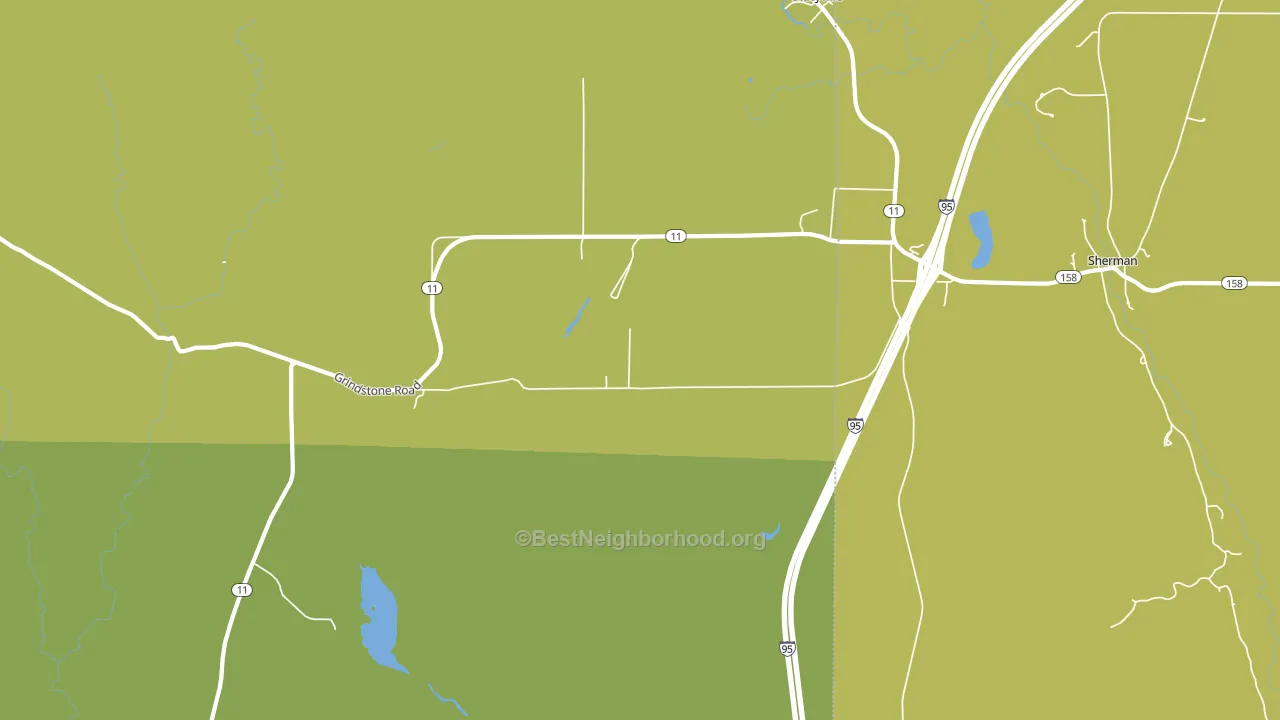
About 71% of adults in Sherman typically vote, above the U.S. average of about 62%. Among adults in Sherman, ~23% vote Democratic, ~48% Republican, and ~29% don't vote. The map below shows estimated turnout by block group.
How Sherman compares
Among cities within 25 miles, Sherman leans more Republican than 6 of 20 neighbors.
Sherman runs about 42 points more Republican than Maine as a whole. Maine leans Democratic overall, while Sherman is one of the few Republican-leaning pockets.
Politics vary noticeably by neighborhood within Sherman. The southeast side is the most Republican-leaning (R+48) and the north side is the least Republican-leaning (R+27), a spread of about 21 points.
Why Sherman leans the way it does
This analysis examined 14,881 data points per city to find what predicts political lean and turnout. The items below are a few correlations that stood out for Sherman, not a ranked or complete list of what matters most.
Sherman votes against the grain of Maine. Maine leans Democratic overall, while Sherman runs about 42 points more Republican.
Population density and Republican lean
Places with low population density tend to lean Republican; Sherman, ME sits in the bottom quarter nationally on this measure.
Why turnout in Sherman looks the way it does
Areas with strong routine healthcare access turn out at higher rates. Sherman is in the top quarter nationally for routine-care measures such as insurance coverage, preventive screenings, and dental visits. The dental-visit rate here is about 52%, about 8 points below the U.S. average of 60%. Learn more about the findings and methodology on the political spectrum map.
Nearby Cities
- Sherman Station, ME R+28
- Sherman Mills, ME R+46
- Benedicta, ME R+47
- Silver Ridge, ME R+47
- Patten, ME R+28
- Island Falls, ME R+45
- Shin Pond, ME R+30
- East Millinocket, ME R+20
- Macwahoc, ME R+46
- Medway, ME R+39
Cities with Similar Populations
- Zoe, KY R+65
- Hudson, LA R+85
- Calhoun, MS R+17
- Holts Crossing, VA R+43
- Dorloo, NY R+41
- West Warren, UT R+68
- Rose Hill, GA R+77
- Hatfield, MO R+68
- Harlan, OR R+32
- Moorewood, OK R+80
Sources and methodology
Precinct-level voting records used to fit the model come from Maine Secretary of State, Bureau of Corporations Elections and Commissions, distributed by the Voting and Election Science Team. Demographic inputs come from the U.S. Census Bureau (ACS 5-year estimates and the 2020 Decennial Census). Health and environmental inputs come from the CDC (PLACES and the Environmental Justice Index). Land cover comes from the USGS and EPA. Election-day and lead-up weather come from PRISM 4km daily grids and the NOAA Global Historical Climatology Network. Mail-voting and election-administration patterns come from the MIT Election Lab's Survey of the Performance of American Elections. Block-group crime detail comes from CrimeGrade. Internet data and modeling support provided by ISPreports.org.
Modeling and analysis by the BestNeighborhood data science team. ME did not have precinct-level voting records available for training, so the figures here come from extrapolation across demographic, health, and land-use features rather than local ground truth. Full methodology and findings: political spectrum map.
Methodology reviewed by the BestNeighborhood data team. Last updated May 2026.