Sherman Park is a Democratic stronghold. About 93% of voters here vote Democratic and 7% Republican.
[sc name="abovemapcta"]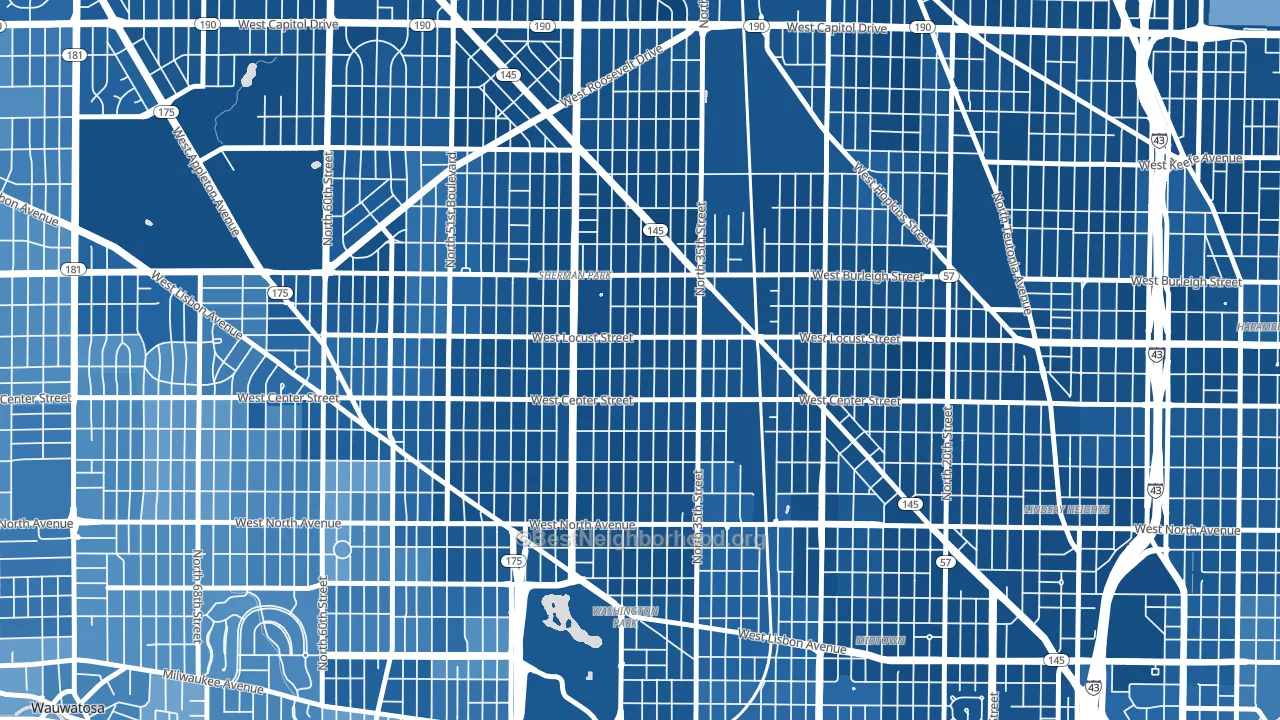 [bestneighborhood_map_controls]
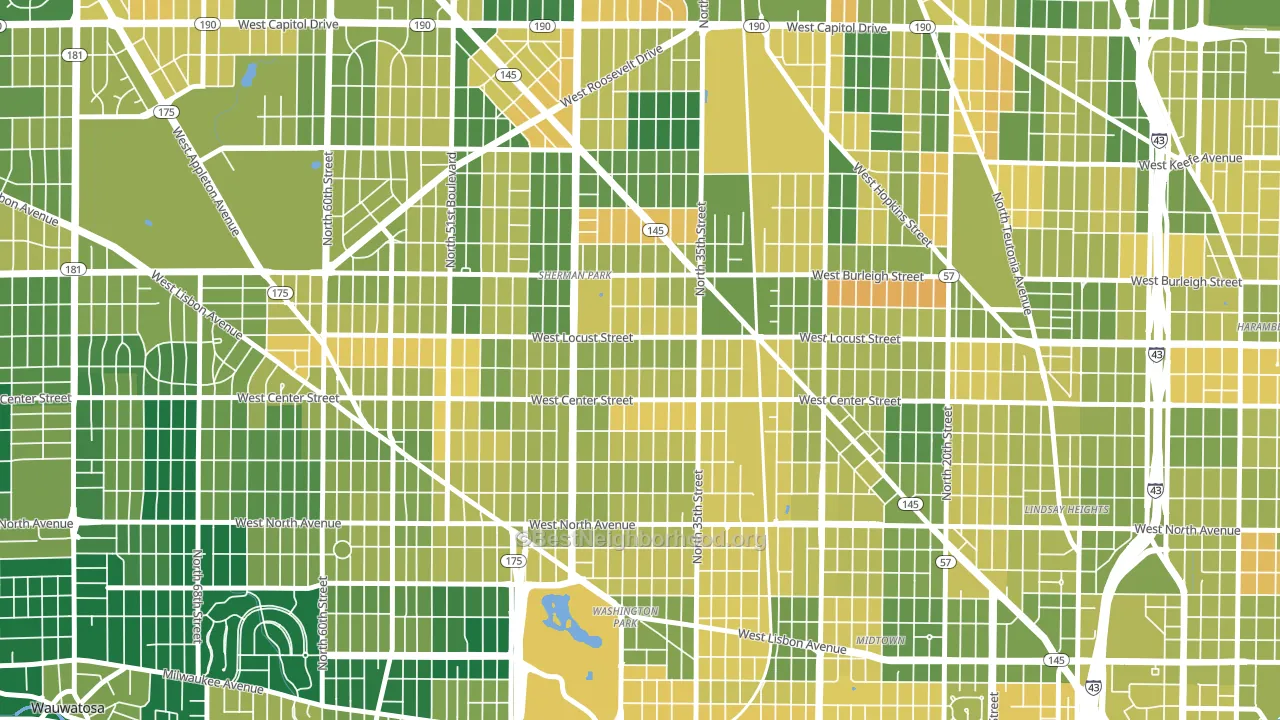
About 64% of adults in Sherman Park typically vote, near the U.S. average of about 62%. Among adults in Sherman Park, ~59% vote Democratic, ~5% Republican, and ~36% don't vote. The map below shows estimated turnout by block group.
 [bestneighborhood_map_controls]
How Sherman Park compares
Among neighborhoods within 5 miles, Sherman Park leans more Democratic than 48 of 54 neighbors.
Sherman Park runs about 87 points more Democratic than Wisconsin as a whole. Wisconsin is roughly evenly split, and Sherman Park sits clearly on the Democratic side.
Why Sherman Park leans the way it does
This analysis examined 14,881 data points per neighborhood to find what predicts political lean and turnout. The items below are a few correlations that stood out for Sherman Park, not a ranked or complete list of what matters most.
Dense areas vote Democratic. More than 99% of residents in Sherman Park live in densely developed areas, about 64 points above the U.S. average of 36%. A high never-married share predicts Democratic voting, and about 63% of adults in Sherman Park have never been married, above 95% of neighborhoods. Sherman Park runs against the grain of Wisconsin, a Democratic-leaning outlier in a roughly evenly split state.
Developed land and Democratic lean
Places with a heavily developed built environment tend to lean Democratic; Sherman Park, Milwaukee, WI sits in the top quarter nationally on this measure. Developed land does not change how people vote; it mostly reflects how urban a place is.
Why turnout in Sherman Park looks the way it does
Limited routine healthcare access lines up with lower turnout, and Sherman Park sits in the bottom quarter on routine-care measures. Learn more about the findings and methodology on the political spectrum map.
[one_half]Nearby Neighborhoods
- Saint Joseph, Milwaukee, WI D+80
- Sunset Heights, Milwaukee, WI D+77
- Uptown, Milwaukee, WI D+76
- Park West, Milwaukee, WI D+86
- Roosevelt Grove, Milwaukee, WI D+88
- Washington Park, Milwaukee, WI D+68
- Franklin Heights, Milwaukee, WI D+88
- Grasslyn Manor, Milwaukee, WI D+80
- Washington Heights, Milwaukee, WI D+62
- Midtown, Milwaukee, WI D+78
Neighborhoods with Similar Populations
- Highlands Park, Renton, WA D+37
- College Heights, Wellesley, MA D+54
- Roscoe Village, Chicago, IL D+70
- South Modesto Acres, Modesto, CA D+21
- Flower Park, Santa Ana, CA D+20
- Ventura Village, Minneapolis, MN D+62
- On Top of The World, Clearwater, FL R+9
- Del Norte, Albuquerque, NM D+28
- Woodstone, San Antonio, TX D+6
- Del Cerro, San Diego, CA D+27
Sources and methodology
Precinct-level voting records used to fit the model come from Wisconsin Elections Commission, distributed by the Voting and Election Science Team. Demographic inputs come from the U.S. Census Bureau (ACS 5-year estimates and the 2020 Decennial Census). Health and environmental inputs come from the CDC (PLACES and the Environmental Justice Index). Land cover comes from the USGS and EPA. Election-day and lead-up weather come from PRISM 4km daily grids and the NOAA Global Historical Climatology Network. Mail-voting and election-administration patterns come from the MIT Election Lab's Survey of the Performance of American Elections. Block-group crime detail comes from CrimeGrade. Internet data and modeling support provided by ISPreports.org.
Modeling and analysis by the BestNeighborhood data science team. Full methodology and findings: political spectrum map.
Methodology reviewed by the BestNeighborhood data team. Last updated May 2026.