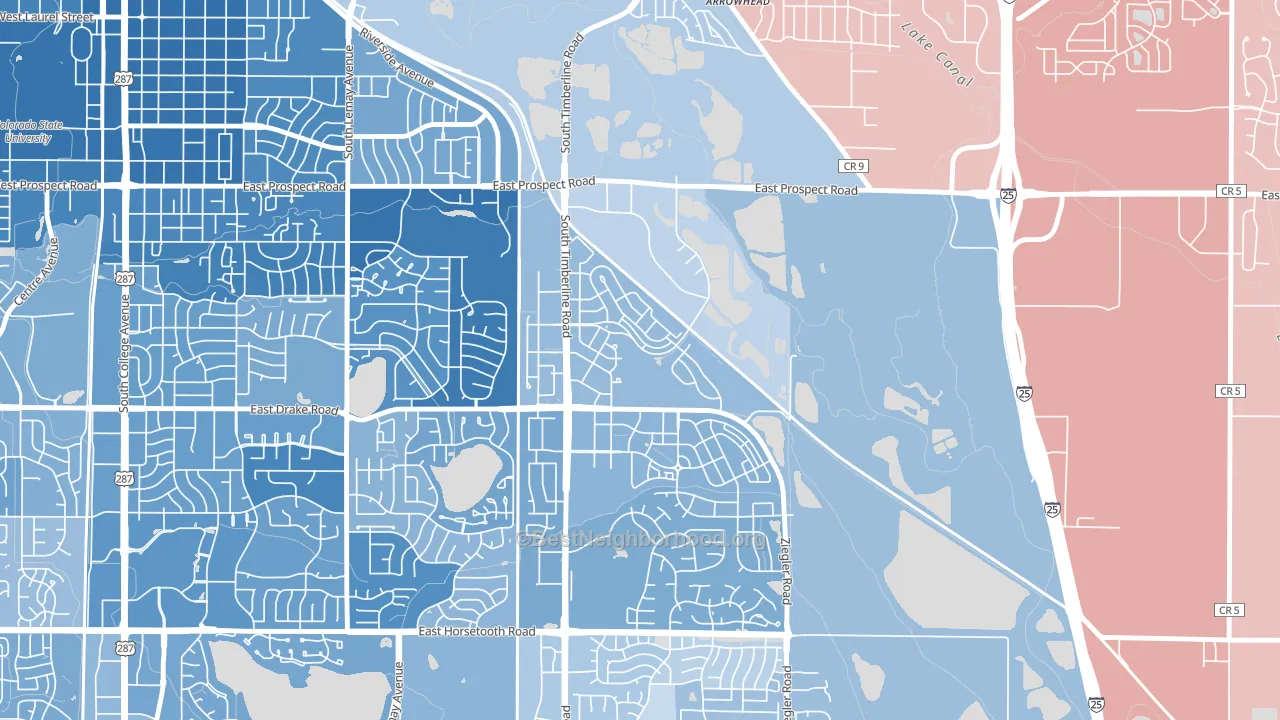
Side Hill leans heavily Democratic by roughly 32 points: about 66% of voters vote Democratic and 34% Republican.
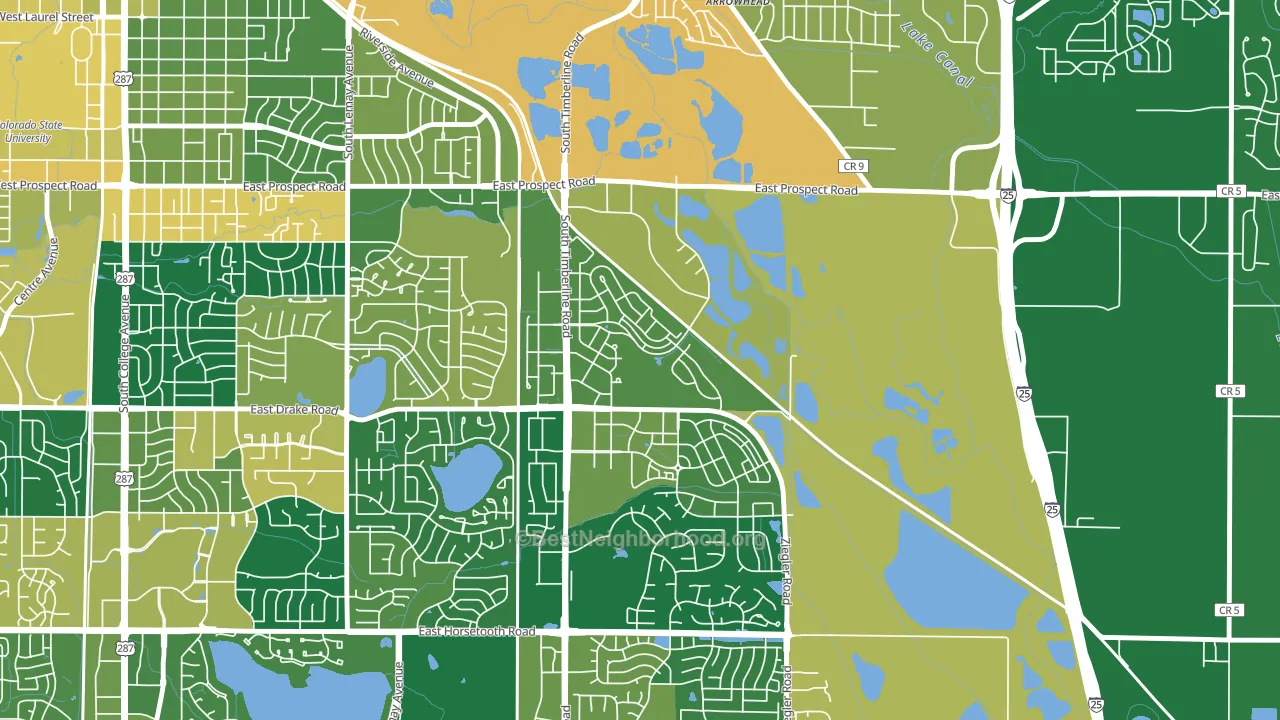
About 80% of adults in Side Hill typically vote, above the U.S. average of about 62%. Among adults in Side Hill, ~53% vote Democratic, ~27% Republican, and ~20% don't vote. The map below shows estimated turnout by block group.
How Side Hill compares
Among neighborhoods within 5 miles, Side Hill leans more Democratic than 1 of 5 neighbors.
Side Hill runs about 21 points more Democratic than Colorado as a whole.
Why Side Hill leans the way it does
Density, race composition, education, and family structure all sit close to their national averages in Side Hill. The lean here lands roughly where demographic data alone would predict.
Preventive-care access and voter turnout
Places with strong routine preventive-care access tend to turn out at a higher rate; Side Hill, Fort Collins, CO sits in the top quarter nationally on this measure. Dental visits do not drive turnout; the rate reflects income, insurance, and healthcare access, which line up with who votes.
Why turnout in Side Hill looks the way it does
Turnout in Side Hill sits close to the national pattern. Routine healthcare access, homeownership, education, and food security all land near their national averages here. Learn more about the findings and methodology on the political spectrum map.
Nearby Neighborhoods
- Fairway Estates, Fort Collins, CO D+30
- University North, Fort Collins, CO D+59
- Troutman Park, Fort Collins, CO D+32
- Prospect-Shields, Fort Collins, CO D+45
- Rogers Park, Fort Collins, CO D+46
- Palo Park, Boulder, CO D+64
- North Boulder, Boulder, CO D+72
- East Boulder, Boulder, CO D+61
- Crossroads, Boulder, CO D+73
- Washington Village, Boulder, CO D+77
Neighborhoods with Similar Populations
- Sundale, Fremont, CA D+34
- Mahncke Park, San Antonio, TX D+33
- Groves Lincoln Park, Tucson, AZ Even
- Hampton Cove, Owens Cross Roads, AL R+37
- Countryside Woods, Vancouver, WA D+13
- Ventura, San Antonio, TX D+22
- Lookout Valley, Chattanooga, TN R+38
- Downtown Berkeley, Berkeley, CA D+76
- Collins Gardens, San Antonio, TX D+36
- Barnum, Denver, CO D+51
Sources and methodology
Precinct-level voting records used to fit the model come from Colorado Secretary of State, Elections, distributed by the Voting and Election Science Team. Demographic inputs come from the U.S. Census Bureau (ACS 5-year estimates and the 2020 Decennial Census). Health and environmental inputs come from the CDC (PLACES and the Environmental Justice Index). Land cover comes from the USGS and EPA. Election-day and lead-up weather come from PRISM 4km daily grids and the NOAA Global Historical Climatology Network. Mail-voting and election-administration patterns come from the MIT Election Lab's Survey of the Performance of American Elections. Block-group crime detail comes from CrimeGrade. Internet data and modeling support provided by ISPreports.org.
Modeling and analysis by the BestNeighborhood data science team. Full methodology and findings: political spectrum map.
Methodology reviewed by the BestNeighborhood data team. Last updated May 2026.