Collins Gardens leans heavily Democratic by roughly 36 points: about 68% of voters vote Democratic and 32% Republican.

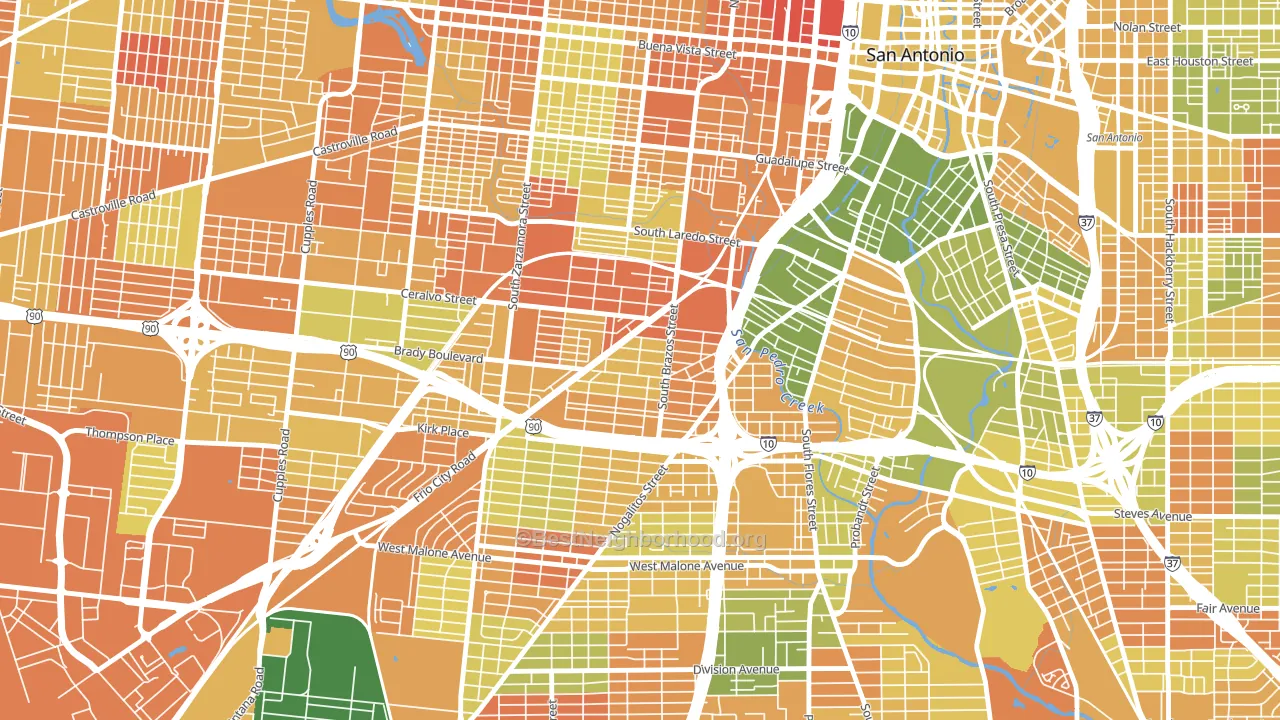
About 32% of adults in Collins Gardens typically vote, below the U.S. average of about 62%. Among adults in Collins Gardens, ~22% vote Democratic, ~10% Republican, and ~68% don't vote. The map below shows estimated turnout by block group.
How Collins Gardens compares
Among neighborhoods within 5 miles, Collins Gardens leans more Democratic than 25 of 38 neighbors.
Collins Gardens runs about 50 points more Democratic than Texas as a whole. Texas leans Republican overall, while Collins Gardens is one of the few Democratic-leaning pockets.
Why Collins Gardens leans the way it does
This analysis examined 14,881 data points per neighborhood to find what predicts political lean and turnout. The items below are a few correlations that stood out for Collins Gardens, not a ranked or complete list of what matters most.
Dense areas vote Democratic. More than 99% of residents in Collins Gardens live in densely developed areas, about 64 points above the U.S. average of 36%. A high never-married share predicts Democratic voting, and about 46% of adults in Collins Gardens have never been married, above 76% of neighborhoods. Collins Gardens runs against the grain of Texas, a Democratic-leaning pocket in a Republican-leaning state.
Paved land cover and Democratic lean
Places with extensive paved surfaces tend to lean Democratic; Collins Gardens, San Antonio, TX sits in the top quarter nationally on this measure. Paved ground does not change how people vote; it mostly reflects how urban and built-up a place is.
Why turnout in Collins Gardens looks the way it does
Areas with limited routine healthcare access turn out at lower rates. Collins Gardens is in the bottom quarter nationally for routine-care measures such as insurance coverage, preventive screenings, and dental visits. The dental-visit rate here is about 40%, about 14 points below the Texas average of 54%. Low high-school completion lines up with lower turnout, and about 73% of adults in Collins Gardens have completed high school, below 93% of neighborhoods. High-crime urban areas turn out at lower rates, and Collins Gardens sits in the top 15% on a violent-crime measure. Learn more about the findings and methodology on the political spectrum map.
Nearby Neighborhoods
- Brady Gardens, San Antonio, TX D+34
- Palm Heights, San Antonio, TX D+33
- Lone Star, San Antonio, TX D+36
- Avenida Guadalupe, San Antonio, TX D+37
- Greater Gardendale, San Antonio, TX D+29
- Cattleman Square, San Antonio, TX D+35
- Columbia Heights, San Antonio, TX D+33
- Thompson Community, San Antonio, TX D+33
- Downtown San Antonio, San Antonio, TX D+36
- Prospect Hill, San Antonio, TX D+39
Neighborhoods with Similar Populations
- Lookout Valley, Chattanooga, TN R+38
- Kranz Woods, Detroit, MI D+87
- South San Gabriel, Rosemead, CA D+24
- Ventura, San Antonio, TX D+22
- Starmount Forest, Greensboro, NC D+39
- Americana, Oak Ridge, FL D+57
- Candlewood Park, San Antonio, TX D+29
- Hampton Cove, Owens Cross Roads, AL R+37
- Groves Lincoln Park, Tucson, AZ Even
- South Fountain Avenue Historic District, Springfield, OH D+40
Sources and methodology
Precinct-level voting records used to fit the model come from Texas Secretary of State, Elections Division, distributed by the Voting and Election Science Team. Demographic inputs come from the U.S. Census Bureau (ACS 5-year estimates and the 2020 Decennial Census). Health and environmental inputs come from the CDC (PLACES and the Environmental Justice Index). Land cover comes from the USGS and EPA. Election-day and lead-up weather come from PRISM 4km daily grids and the NOAA Global Historical Climatology Network. Mail-voting and election-administration patterns come from the MIT Election Lab's Survey of the Performance of American Elections. Block-group crime detail comes from CrimeGrade. Internet data and modeling support provided by ISPreports.org.
Modeling and analysis by the BestNeighborhood data science team. Full methodology and findings: political spectrum map.
Methodology reviewed by the BestNeighborhood data team. Last updated May 2026.