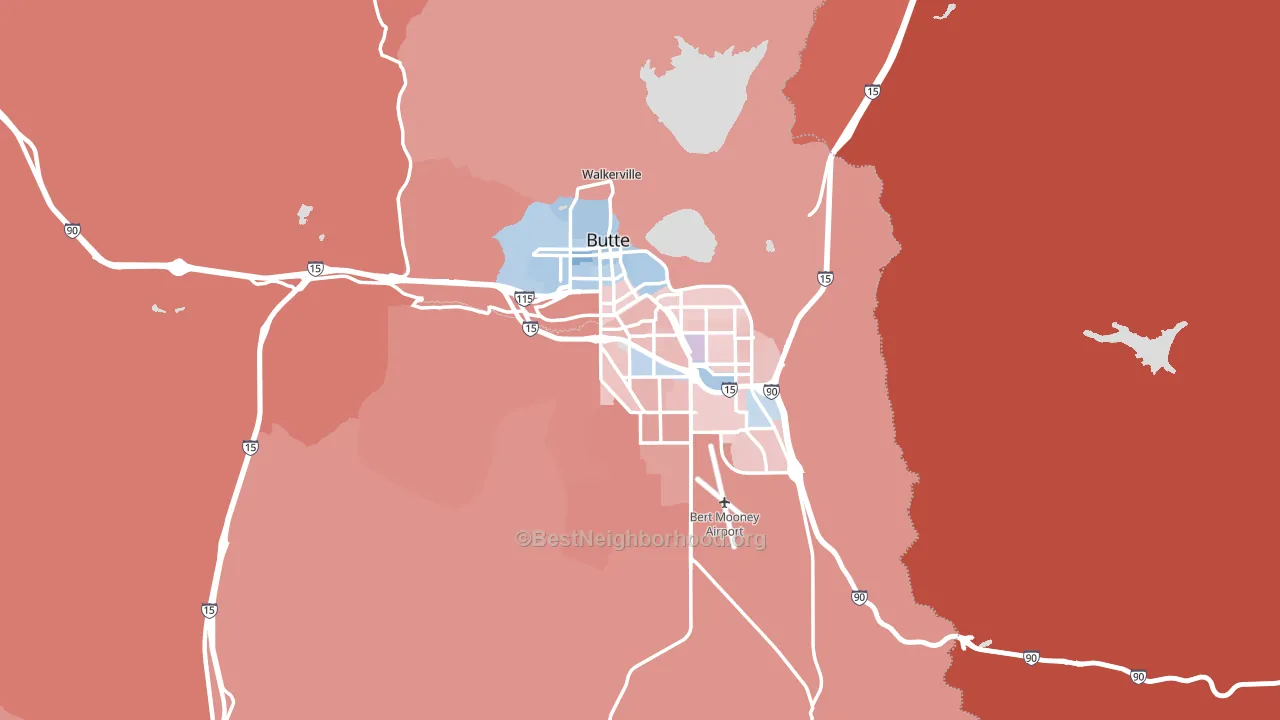
Silver Bow County is a true toss-up. About 49% of voters here vote Democratic and 51% Republican.
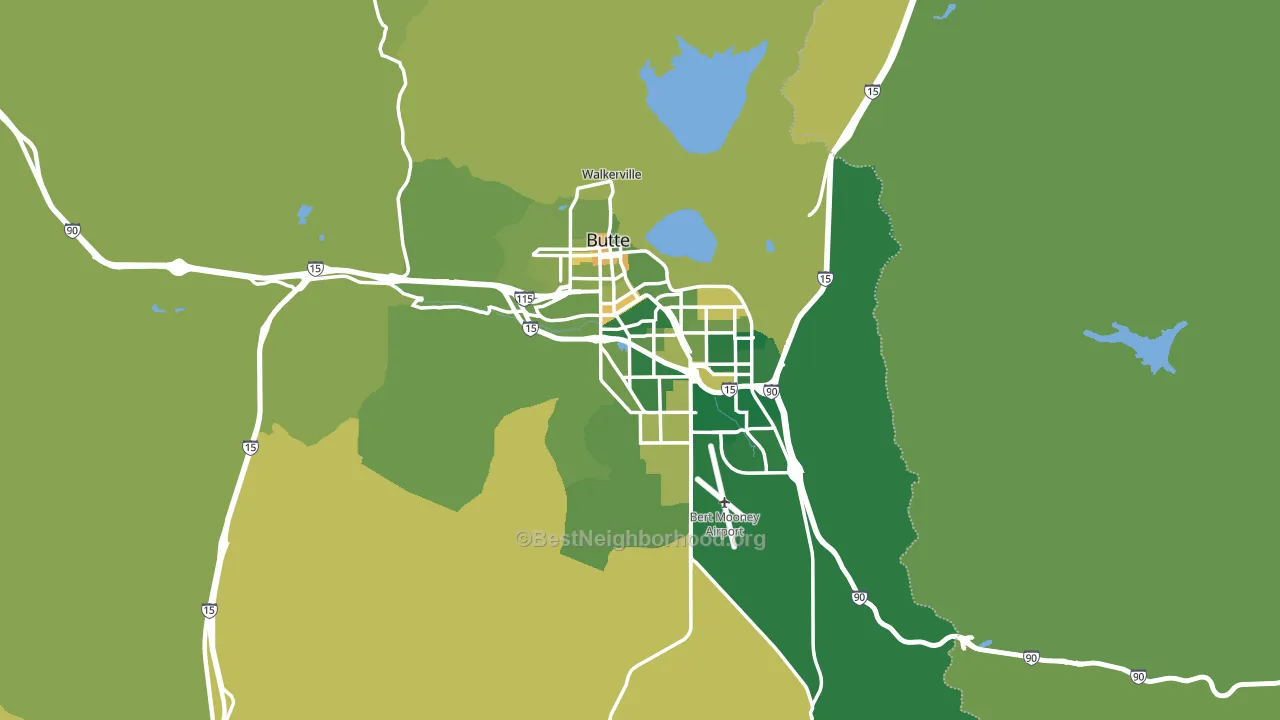
About 78% of adults in Silver Bow County typically vote, above the U.S. average of about 62%. Among adults in Silver Bow County, ~38% vote Democratic, ~40% Republican, and ~22% don't vote. The map below shows estimated turnout by block group.
How Silver Bow County compares
Among counties within 50 miles, Silver Bow County sits roughly in the middle of the political spectrum, with 0 neighbors leaning further in the place's direction and 5 leaning the other way.
Silver Bow County runs about 18 points more Democratic than Montana as a whole.
Politics vary noticeably by city within Silver Bow County. The north side runs the most Democratic (D+7) and the southwest side runs the most Republican (R+30), a spread of about 37 points.
Why Silver Bow County leans the way it does
This analysis examined 14,881 data points per county to find what predicts political lean and turnout. The items below are a few correlations that stood out for Silver Bow County, not a ranked or complete list of what matters most.
Density pulls a place toward Democrats and a high white share pulls it toward Republicans. In Silver Bow County the two roughly cancel.
Walkability and Democratic lean
Places with a highly walkable street grid tend to lean Democratic; Silver Bow County, MT sits in the top tenth nationally on this measure. A walkable street grid does not change how people vote; it mostly reflects how urban a place is.
Why turnout in Silver Bow County looks the way it does
Areas with high high-school completion turn out at higher rates. About 94% of adults in Silver Bow County have completed high school, above 87% of counties. Learn more about the findings and methodology on the political spectrum map.
Nearby Counties
- Deer Lodge County, MT R+18
- Jefferson County, MT R+38
- Powell County, MT R+48
- Madison County, MT R+46
- Granite County, MT R+38
- Broadwater County, MT R+54
- Lewis and Clark County, MT R+7
- Beaverhead County, MT R+42
- Gallatin County, MT D+6
- Ravalli County, MT R+43
Counties with Similar Populations
- Becker County, MN R+33
- Lincoln County, ME Even
- Monroe County, IL R+39
- Morrow County, OH R+58
- Lincoln County, TN R+64
- Lincoln County, MS R+37
- Howard County, TX R+50
- Perry County, OH R+56
- Wapello County, IA R+26
- Wasatch County, UT R+33
Sources and methodology
Precinct-level voting records used to fit the model come from Montana Secretary of State, Elections, distributed by the Voting and Election Science Team. Demographic inputs come from the U.S. Census Bureau (ACS 5-year estimates and the 2020 Decennial Census). Health and environmental inputs come from the CDC (PLACES and the Environmental Justice Index). Land cover comes from the USGS and EPA. Election-day and lead-up weather come from PRISM 4km daily grids and the NOAA Global Historical Climatology Network. Mail-voting and election-administration patterns come from the MIT Election Lab's Survey of the Performance of American Elections. Block-group crime detail comes from CrimeGrade. Internet data and modeling support provided by ISPreports.org.
Modeling and analysis by the BestNeighborhood data science team. Full methodology and findings: political spectrum map.
Methodology reviewed by the BestNeighborhood data team. Last updated May 2026.