Sinking Spring is a Republican stronghold. About 16% of voters here vote Democratic and 84% Republican.
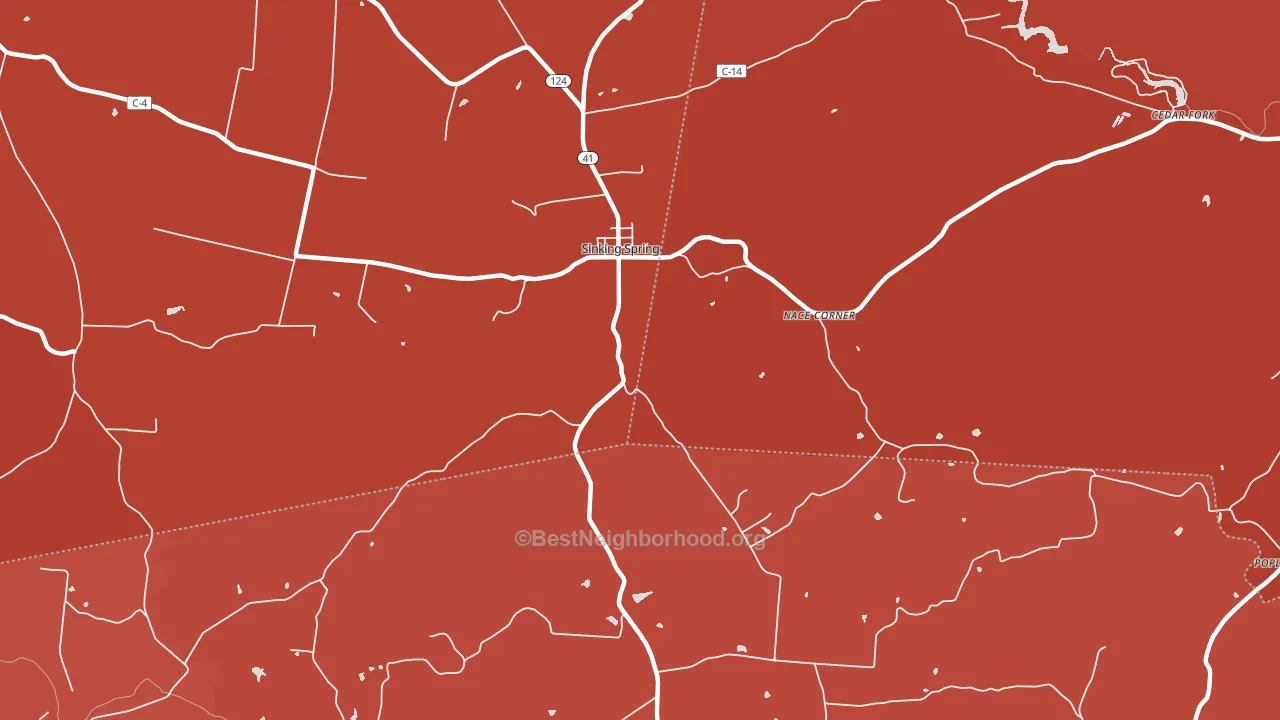
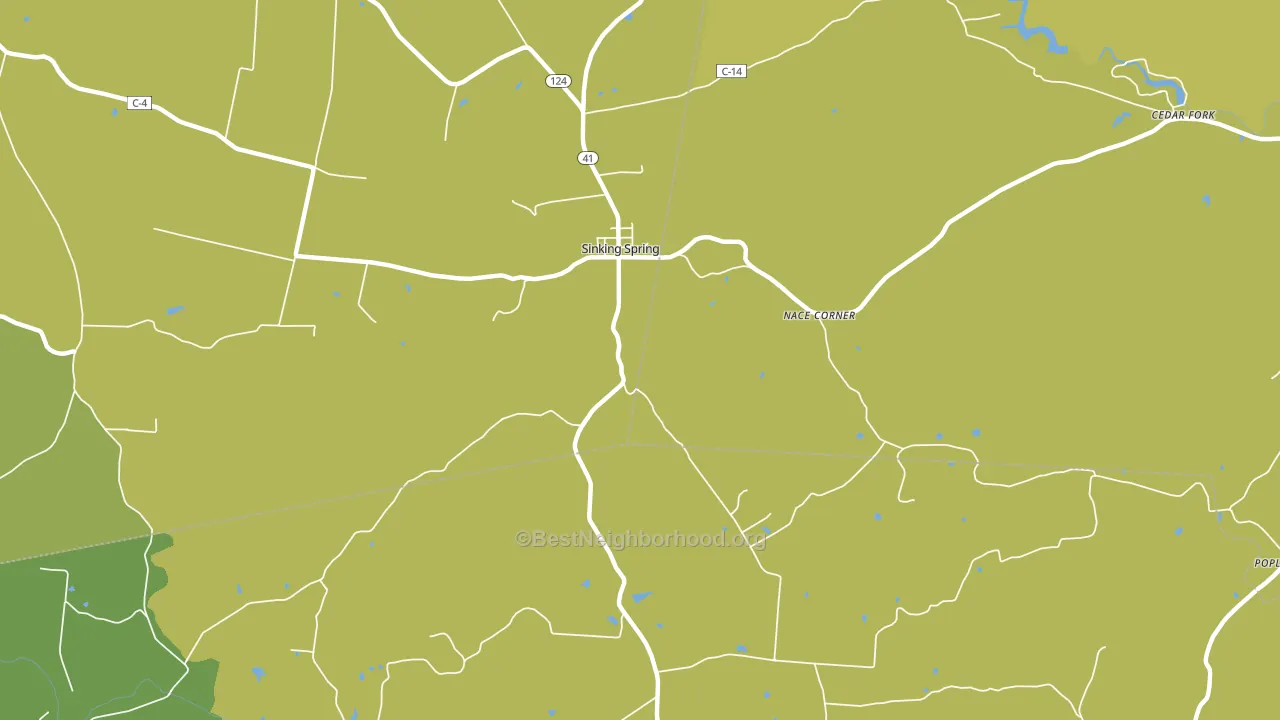
About 60% of adults in Sinking Spring typically vote, near the U.S. average of about 62%. Among adults in Sinking Spring, ~10% vote Democratic, ~50% Republican, and ~40% don't vote. The map below shows estimated turnout by block group.
How Sinking Spring compares
Among cities within 25 miles, Sinking Spring leans more Republican than 79 of 86 neighbors.
Sinking Spring runs about 57 points more Republican than Ohio as a whole.
Why Sinking Spring leans the way it does
This analysis examined 14,881 data points per city to find what predicts political lean and turnout. The items below are a few correlations that stood out for Sinking Spring, not a ranked or complete list of what matters most.
Areas with low college attainment vote Republican. About 10% of adults in Sinking Spring hold a bachelor's degree, about 13 points below the Ohio average of 23%.
Cancer-screening access and voter turnout
Places with low colon-cancer-screening access tend to turn out at a lower rate; Sinking Spring, OH sits in the bottom quarter nationally on this measure. Cancer screening does not drive turnout; it reflects income, insurance, and healthcare access.
Why turnout in Sinking Spring looks the way it does
Areas with low high-school completion turn out at lower rates. About 79% of adults in Sinking Spring have completed high school, about 11 points below the U.S. average of 90%. Learn more about the findings and methodology on the political spectrum map.
Nearby Cities
- Lincolnville, OH R+69
- Latham, OH R+67
- Harshasville, OH R+68
- North Uniontown, OH R+67
- Peebles, OH R+64
- Carmel, OH R+68
- Harriett, OH R+66
- Cynthiana, OH R+68
- Marshall, OH R+65
- Lawshe, OH R+63
Cities with Similar Populations
- West Panama City Beach, FL R+69
- Robertsville, AR R+60
- Overton, PA R+65
- Board Camp, AR R+64
- Bypro, KY R+58
- North Hillsdale, NY D+37
- Blankston, LA R+48
- Bluffton, GA D+8
- Hudson, KS R+76
- Mauricetown, NJ R+35
Sources and methodology
Precinct-level voting records used to fit the model come from Ohio Secretary of State, Elections, distributed by the Voting and Election Science Team. Demographic inputs come from the U.S. Census Bureau (ACS 5-year estimates and the 2020 Decennial Census). Health and environmental inputs come from the CDC (PLACES and the Environmental Justice Index). Land cover comes from the USGS and EPA. Election-day and lead-up weather come from PRISM 4km daily grids and the NOAA Global Historical Climatology Network. Mail-voting and election-administration patterns come from the MIT Election Lab's Survey of the Performance of American Elections. Block-group crime detail comes from CrimeGrade. Internet data and modeling support provided by ISPreports.org.
Modeling and analysis by the BestNeighborhood data science team. Full methodology and findings: political spectrum map.
Methodology reviewed by the BestNeighborhood data team. Last updated May 2026.