Stark County leans heavily Republican by roughly 48 points: about 26% of voters vote Democratic and 74% Republican.
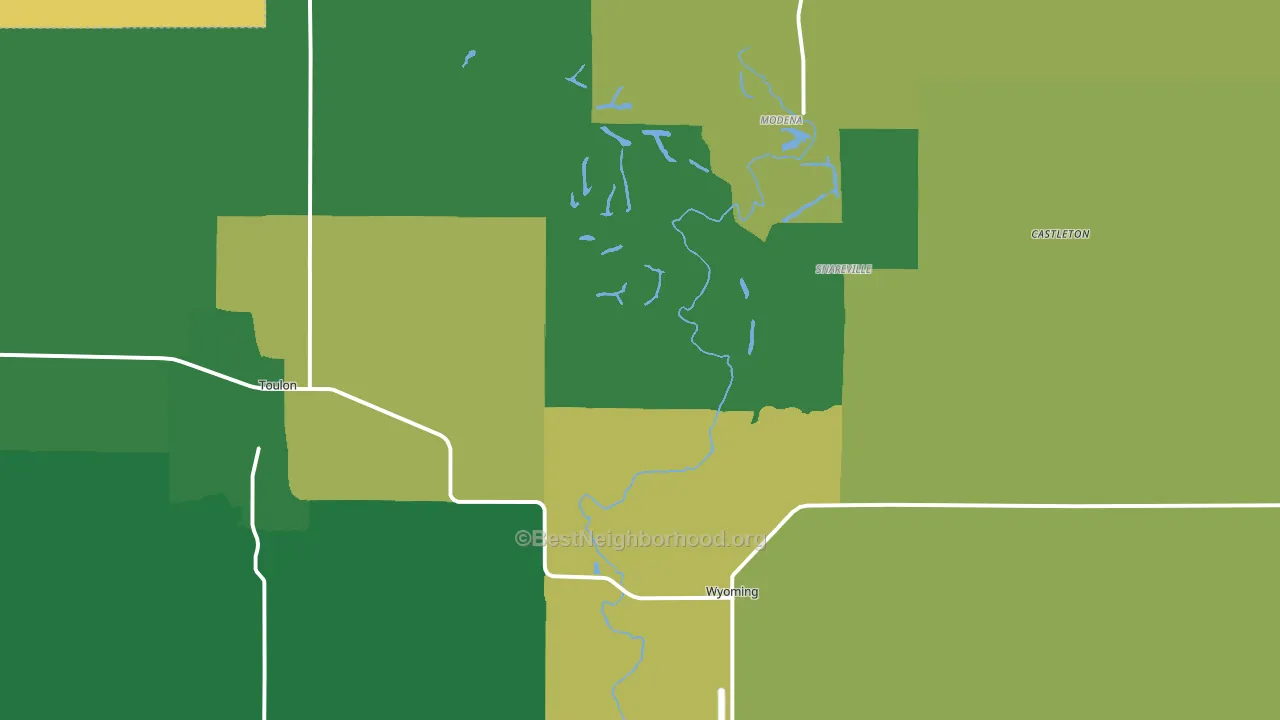
About 79% of adults in Stark County typically vote, above the U.S. average of about 62%. Among adults in Stark County, ~20% vote Democratic, ~59% Republican, and ~21% don't vote. The map below shows estimated turnout by block group.
How Stark County compares
Among counties within 50 miles, Stark County is the most Republican-leaning.
Stark County runs about 58 points more Republican than Illinois as a whole. Illinois leans Democratic overall, while Stark County is one of the few Republican-leaning pockets.
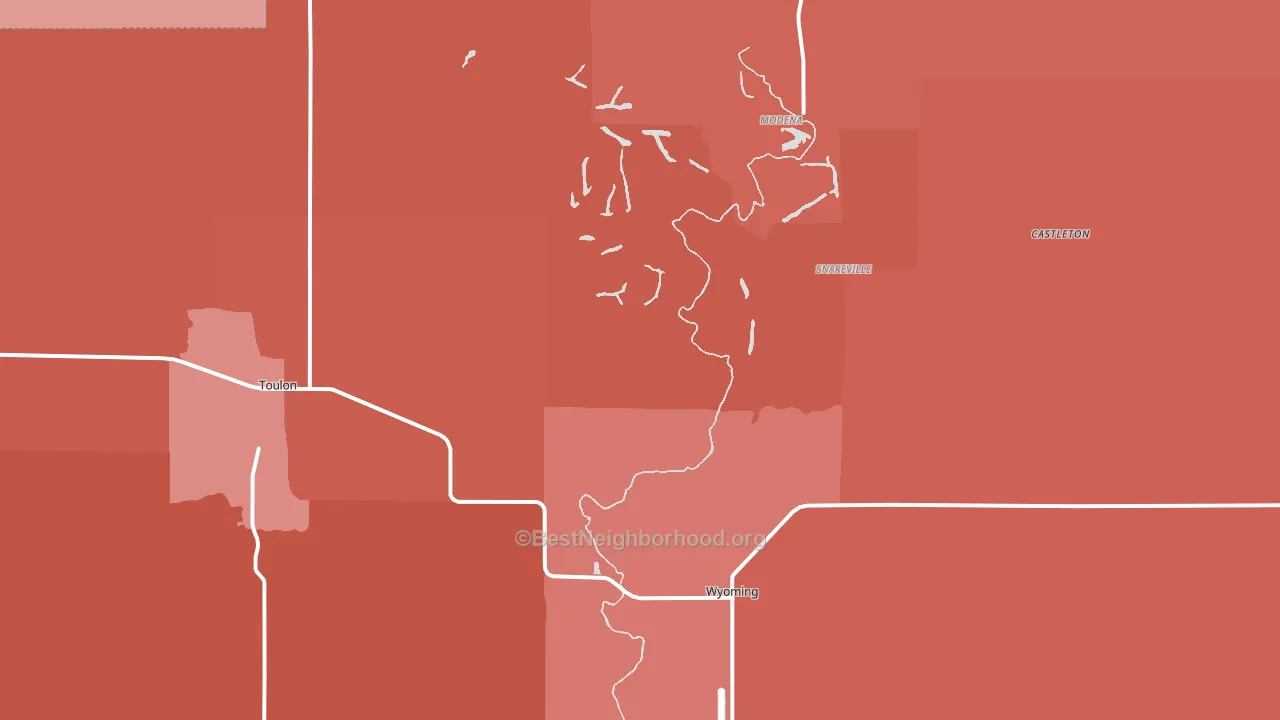
Politics vary noticeably by city within Stark County. The southeast side is the most Republican-leaning (R+56) and the west side is the least Republican-leaning (R+42), a spread of about 14 points.
Why Stark County leans the way it does
This analysis examined 14,881 data points per county to find what predicts political lean and turnout. The items below are a few correlations that stood out for Stark County, not a ranked or complete list of what matters most.
Stark County votes against the grain of Illinois. Illinois leans Democratic overall, while Stark County runs about 58 points more Republican. Rural areas with a high white share vote Republican. Non-Hispanic white share in Stark County is about 90%, well above similar-sized counties (around 67%).
Population density and Republican lean
Places with low population density tend to lean Republican; Stark County, IL sits in the bottom quarter nationally on this measure.
Why turnout in Stark County looks the way it does
Homeowners vote more often than renters. About 81% of households in Stark County own their home, about 6 points above the U.S. average of 75%. Learn more about the findings and methodology on the political spectrum map.
Nearby Counties
- Henry County, IL R+24
- Marshall County, IL R+37
- Peoria County, IL D+14
- Bureau County, IL R+27
- Putnam County, IL R+28
- Knox County, IL R+9
- Woodford County, IL R+40
- Tazewell County, IL R+29
- Fulton County, IL R+31
- Rock Island County, IL D+12
Counties with Similar Populations
- Floyd County, TX R+50
- Mahnomen County, MN R+16
- Morris County, KS R+52
- Haskell County, TX R+65
- Hartley County, TX R+76
- Boone County, NE R+64
- Day County, SD R+42
- Cherry County, NE R+67
- McHenry County, ND R+61
- Yukon-Koyukuk Census Area, AK D+17
Sources and methodology
Precinct-level voting records used to fit the model come from Illinois State Board of Elections, distributed by the Voting and Election Science Team. Demographic inputs come from the U.S. Census Bureau (ACS 5-year estimates and the 2020 Decennial Census). Health and environmental inputs come from the CDC (PLACES and the Environmental Justice Index). Land cover comes from the USGS and EPA. Election-day and lead-up weather come from PRISM 4km daily grids and the NOAA Global Historical Climatology Network. Mail-voting and election-administration patterns come from the MIT Election Lab's Survey of the Performance of American Elections. Block-group crime detail comes from CrimeGrade. Internet data and modeling support provided by ISPreports.org.
Modeling and analysis by the BestNeighborhood data science team. Full methodology and findings: political spectrum map.
Methodology reviewed by the BestNeighborhood data team. Last updated May 2026.