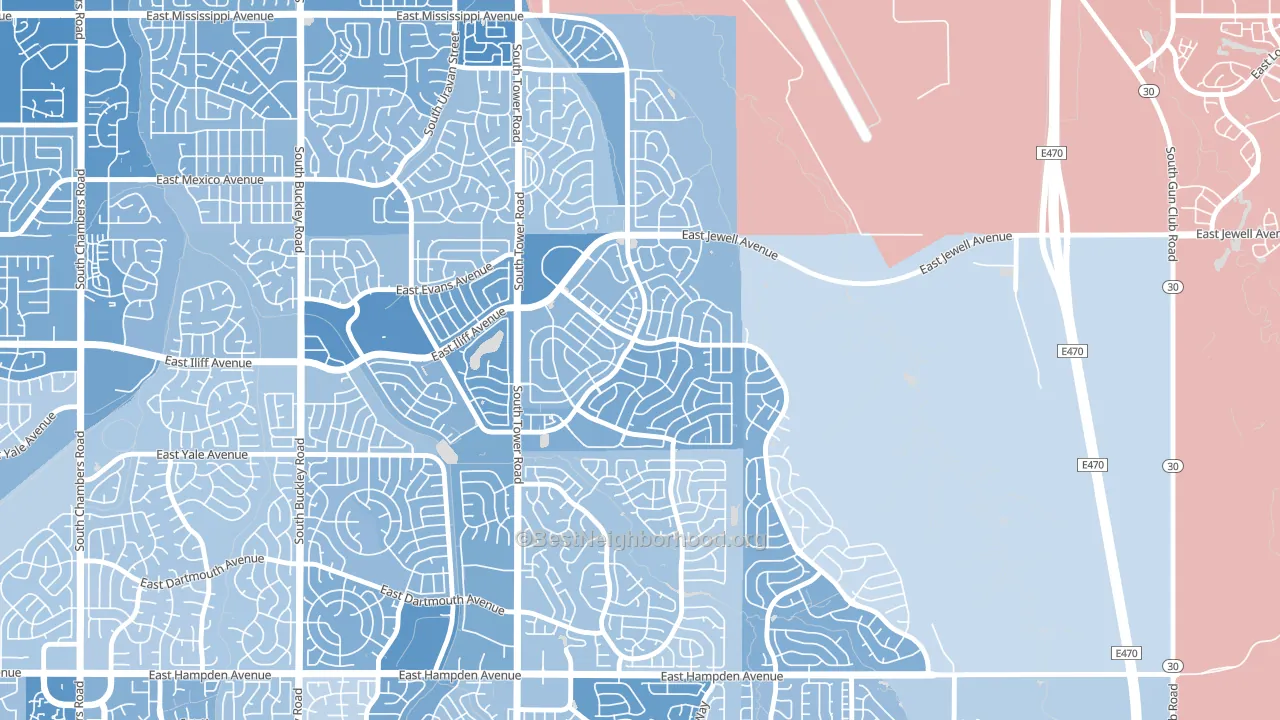
Sterling Hills leans Democratic by roughly 26 points: about 63% of voters vote Democratic and 37% Republican.
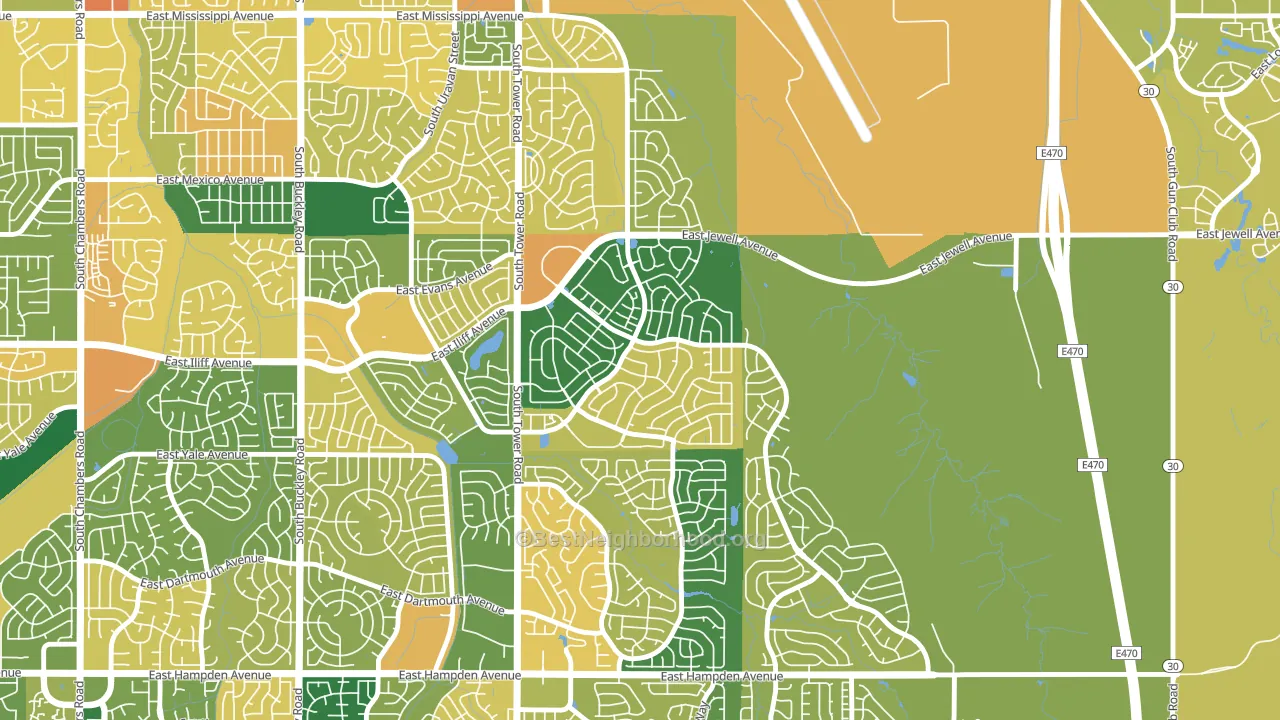
About 77% of adults in Sterling Hills typically vote, above the U.S. average of about 62%. Among adults in Sterling Hills, ~49% vote Democratic, ~29% Republican, and ~22% don't vote. The map below shows estimated turnout by block group.
How Sterling Hills compares
Among neighborhoods within 5 miles, Sterling Hills leans more Democratic than 15 of 32 neighbors.
Sterling Hills runs about 16 points more Democratic than Colorado as a whole.
Politics vary noticeably by block within Sterling Hills. The southeast side is the most Democratic-leaning (D+32) and the west side is the least Democratic-leaning (D+22), a spread of about 10 points.
Why Sterling Hills leans the way it does
Density, race composition, education, and family structure all sit close to their national averages in Sterling Hills. The lean here lands roughly where demographic data alone would predict.
Population density, never-married share, and Democratic lean
Places that combine high population density and a low never-married share tend to lean Democratic, as Sterling Hills, Aurora, CO does.
Why turnout in Sterling Hills looks the way it does
Turnout in Sterling Hills sits close to the national pattern. Routine healthcare access, homeownership, education, and food security all land near their national averages here. Learn more about the findings and methodology on the political spectrum map.
Nearby Neighborhoods
- Side Creek, Aurora, CO D+23
- Seven Hills, Aurora, CO D+12
- Conservatory, Aurora, CO D+14
- Aurora Highlands, Aurora, CO D+28
- Aurora Knolls-Hutchinson Heights, Aurora, CO D+25
- Tollgate Overlook, Aurora, CO D+36
- Horseshoe Park, Aurora, CO D+24
- Carriage Place, Aurora, CO D+19
- Meadow Wood, Aurora, CO D+12
- Rocky Ridge, Aurora, CO D+32
Neighborhoods with Similar Populations
- Franklin Park, Trenton, NJ D+34
- Reservoir, Little Rock, AR D+34
- Saint Joseph, Milwaukee, WI D+80
- Paseo Ranchoero, Chula Vista, CA D+16
- Calico Ridge, Henderson, NV R+4
- Creekside, Sacramento, CA D+33
- Taylor Berry, Louisville, KY D+43
- Lacy, Santa Ana, CA D+31
- Chapel Hill, Akron, OH D+20
- Chester Highlands, Chicago, IL D+83
Sources and methodology
Precinct-level voting records used to fit the model come from Colorado Secretary of State, Elections, distributed by the Voting and Election Science Team. Demographic inputs come from the U.S. Census Bureau (ACS 5-year estimates and the 2020 Decennial Census). Health and environmental inputs come from the CDC (PLACES and the Environmental Justice Index). Land cover comes from the USGS and EPA. Election-day and lead-up weather come from PRISM 4km daily grids and the NOAA Global Historical Climatology Network. Mail-voting and election-administration patterns come from the MIT Election Lab's Survey of the Performance of American Elections. Block-group crime detail comes from CrimeGrade. Internet data and modeling support provided by ISPreports.org.
Modeling and analysis by the BestNeighborhood data science team. Full methodology and findings: political spectrum map.
Methodology reviewed by the BestNeighborhood data team. Last updated May 2026.