Chapel Hill leans Democratic by roughly 20 points: about 60% of voters vote Democratic and 40% Republican.
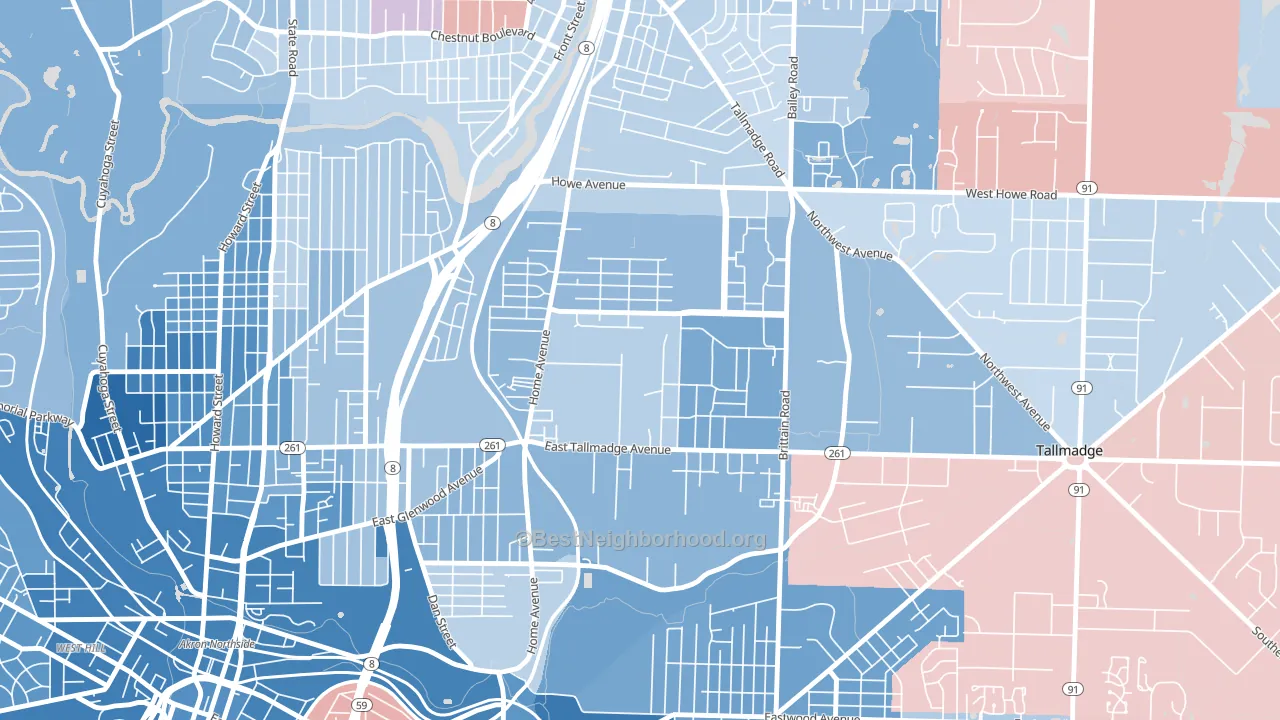
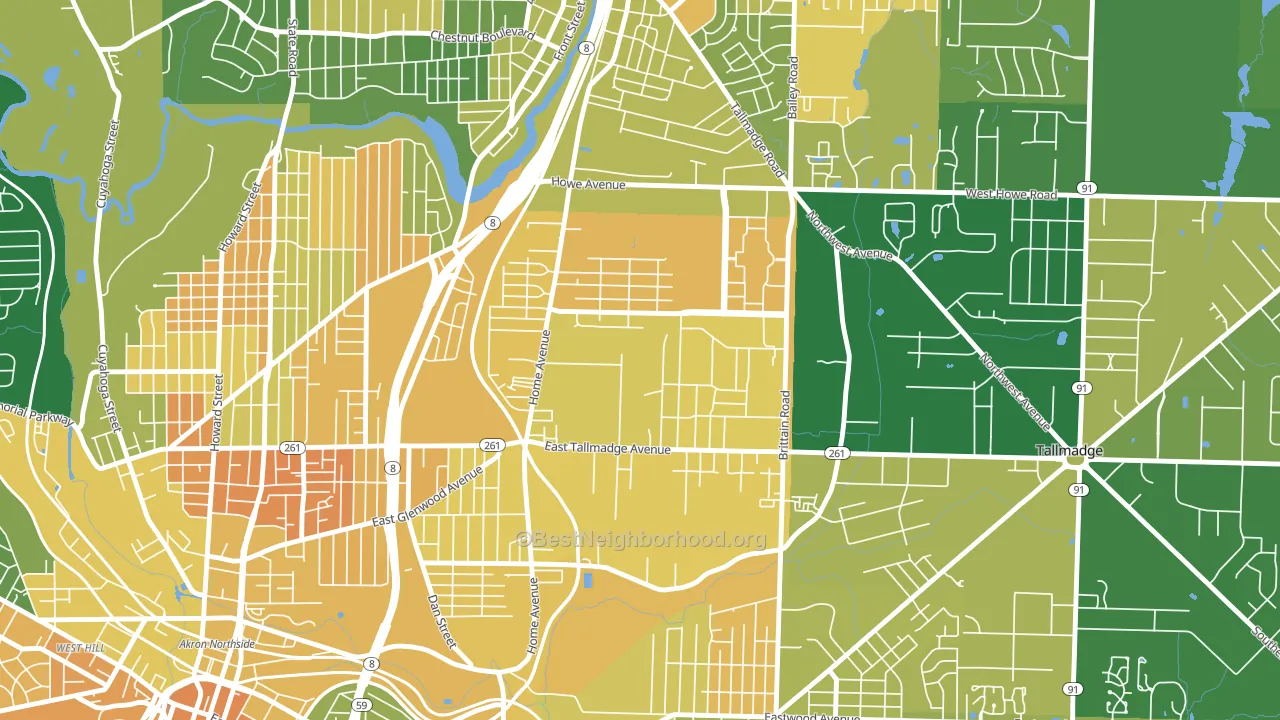
About 49% of adults in Chapel Hill typically vote, below the U.S. average of about 62%. Among adults in Chapel Hill, ~29% vote Democratic, ~20% Republican, and ~51% don't vote. The map below shows estimated turnout by block group.
How Chapel Hill compares
Among neighborhoods within 5 miles, Chapel Hill leans more Democratic than 4 of 19 neighbors.
Chapel Hill runs about 31 points more Democratic than Ohio as a whole. Ohio leans Republican overall, while Chapel Hill is one of the few Democratic-leaning pockets.
Why Chapel Hill leans the way it does
This analysis examined 14,881 data points per neighborhood to find what predicts political lean and turnout. The items below are a few correlations that stood out for Chapel Hill, not a ranked or complete list of what matters most.
Chapel Hill votes against the grain of Ohio. Ohio leans Republican overall, while Chapel Hill runs about 31 points more Democratic.
Paved land cover and Democratic lean
Places with extensive paved surfaces tend to lean Democratic; Chapel Hill, Akron, OH sits in the top quarter nationally on this measure. Paved ground does not change how people vote; it mostly reflects how urban and built-up a place is.
Why turnout in Chapel Hill looks the way it does
Renters vote less often than owners. About 64% of households in Chapel Hill rent, about 39 points above the U.S. average of 25%. High food insecurity lines up with lower turnout, and about 28% of adults in Chapel Hill report food insecurity, above 80% of neighborhoods. Low high-school completion lines up with lower turnout, and about 80% of adults in Chapel Hill have completed high school, below 85% of neighborhoods. Learn more about the findings and methodology on the political spectrum map.
Nearby Neighborhoods
- North Hill, Akron, OH D+27
- East Village, Cuyahoga Falls, OH D+7
- Elizabeth Park Valley, Akron, OH D+46
- West Village, Cuyahoga Falls, OH D+6
- Goodyear Heights, Akron, OH D+22
- Middlebury, Akron, OH D+42
- North Village, Cuyahoga Falls, OH D+7
- University of Ohio Akron, Akron, OH D+49
- Highland Square, Akron, OH D+48
- Downtown Akron, Akron, OH D+62
Neighborhoods with Similar Populations
- Chester Highlands, Chicago, IL D+83
- New River Estates, Sunrise, FL D+5
- Crosstown, Memphis, TN D+60
- Taylor Berry, Louisville, KY D+43
- Saint Joseph, Milwaukee, WI D+80
- Paseo Ranchoero, Chula Vista, CA D+16
- Reservoir, Little Rock, AR D+34
- Franklin Park, Trenton, NJ D+34
- Huguenot, Staten Island, NY R+60
- South Lorain, Lorain, OH D+21
Sources and methodology
Precinct-level voting records used to fit the model come from Ohio Secretary of State, Elections, distributed by the Voting and Election Science Team. Demographic inputs come from the U.S. Census Bureau (ACS 5-year estimates and the 2020 Decennial Census). Health and environmental inputs come from the CDC (PLACES and the Environmental Justice Index). Land cover comes from the USGS and EPA. Election-day and lead-up weather come from PRISM 4km daily grids and the NOAA Global Historical Climatology Network. Mail-voting and election-administration patterns come from the MIT Election Lab's Survey of the Performance of American Elections. Block-group crime detail comes from CrimeGrade. Internet data and modeling support provided by ISPreports.org.
Modeling and analysis by the BestNeighborhood data science team. Full methodology and findings: political spectrum map.
Methodology reviewed by the BestNeighborhood data team. Last updated May 2026.