Sunrise leans Democratic by roughly 26 points: about 63% of voters vote Democratic and 37% Republican.
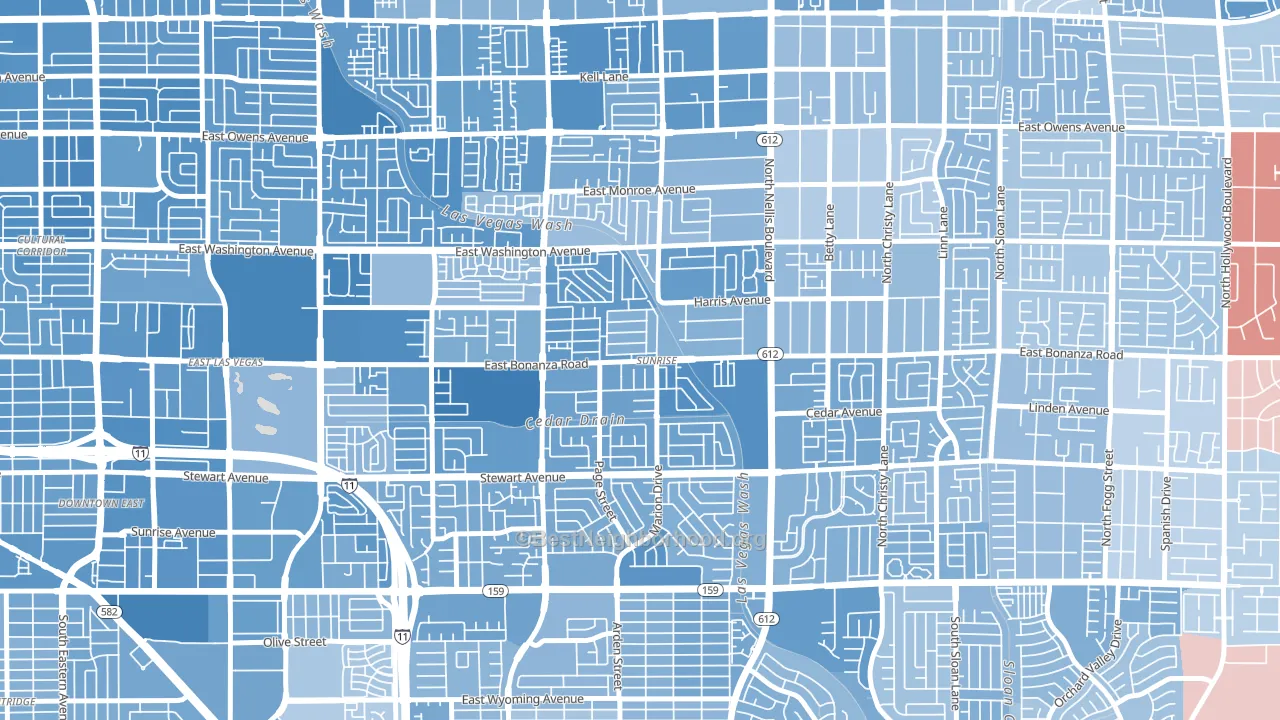
About 34% of adults in Sunrise typically vote, below the U.S. average of about 62%. Among adults in Sunrise, ~21% vote Democratic, ~13% Republican, and ~66% don't vote. The map below shows estimated turnout by block group.
How Sunrise compares
Among neighborhoods within 5 miles, Sunrise is the least Democratic-leaning.
Sunrise runs about 29 points more Democratic than Nevada as a whole. Nevada leans Republican overall, while Sunrise is one of the few Democratic-leaning pockets.
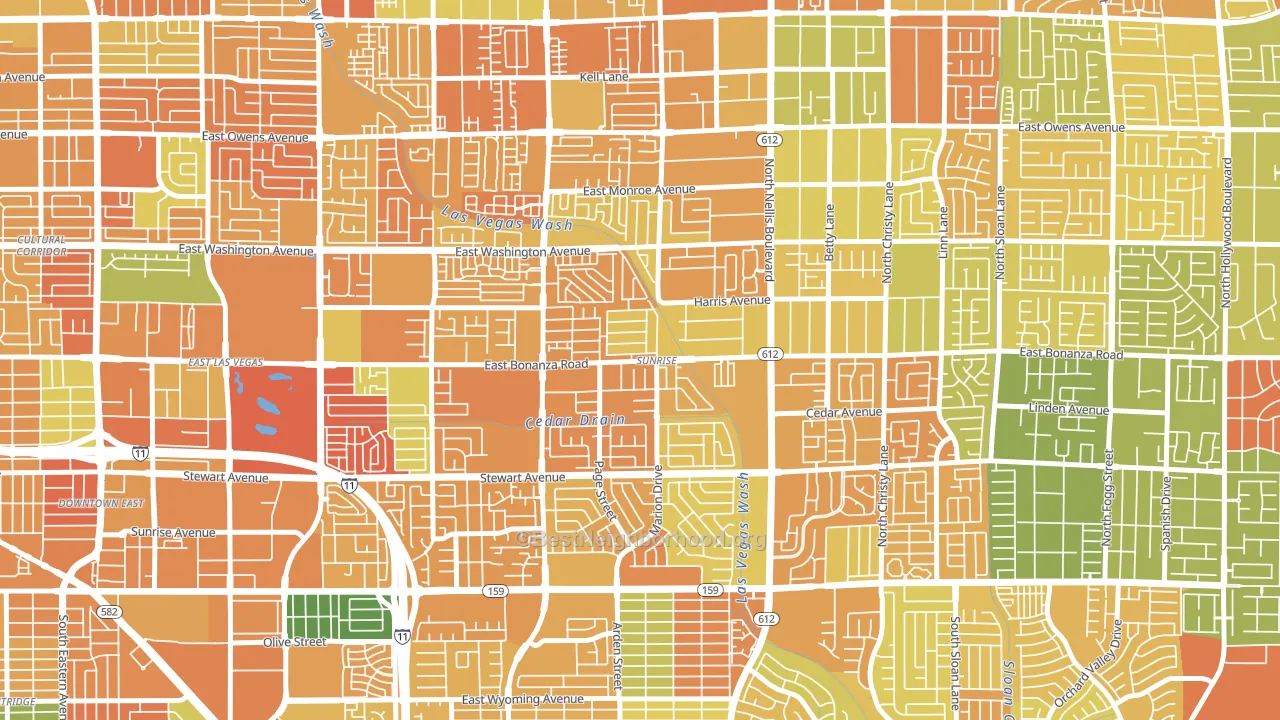
Politics vary noticeably by block within Sunrise. The east side is the most Democratic-leaning (D+33) and the southwest side is the least Democratic-leaning (D+21), a spread of about 11 points.
Why Sunrise leans the way it does
This analysis examined 14,881 data points per neighborhood to find what predicts political lean and turnout. The items below are a few correlations that stood out for Sunrise, not a ranked or complete list of what matters most.
Sunrise votes against the grain of Nevada. Nevada leans Republican overall, while Sunrise runs about 29 points more Democratic. A high never-married share predicts Democratic voting, and about 46% of adults in Sunrise have never been married, above 76% of neighborhoods.
Population density and Democratic lean
Places with high population density tend to lean Democratic; Sunrise, Las Vegas, NV sits in the top tenth nationally on this measure.
Why turnout in Sunrise looks the way it does
Areas with limited routine healthcare access turn out at lower rates. Sunrise is in the bottom quarter nationally for routine-care measures such as insurance coverage, preventive screenings, and dental visits. The dental-visit rate here is about 41%, about 17 points below the Nevada average of 58%. High food insecurity lines up with lower turnout, and about 41% of adults in Sunrise report food insecurity, above 94% of neighborhoods. Low high-school completion lines up with lower turnout, and about 65% of adults in Sunrise have completed high school, below 97% of neighborhoods. Learn more about the findings and methodology on the political spectrum map.
Nearby Neighborhoods
- East Las Vegas, Las Vegas, NV D+30
- Downtown East, Las Vegas, NV D+36
- Cultural Corridor, Las Vegas, NV D+34
- Huntridge, Las Vegas, NV D+29
- Downtown, Las Vegas, NV D+39
- Vegas Heights, North Las Vegas, NV D+57
- University Medical Center, Las Vegas, NV D+31
- West Las Vegas, Las Vegas, NV D+52
- North Last Vegas, North Las Vegas, NV D+23
- Twin Lakes, Las Vegas, NV D+23
Neighborhoods with Similar Populations
- Sheep Mountain, Las Vegas, NV R+12
- Canyon Crest, Riverside, CA D+10
- Stanford University, Stanford, CA D+64
- Hunting Park, Philadelphia, PA D+64
- Queen Anne, Seattle, WA D+74
- Harder-Tennyson, Hayward, CA D+37
- Wicker Park, Chicago, IL D+71
- Central Boulder, Boulder, CO D+71
- Northeast Tacoma, Tacoma, WA D+23
- Eads-Fisherville, Cordova, TN D+31
Sources and methodology
Precinct-level voting records used to fit the model come from Nevada Secretary of State, Elections, distributed by the Voting and Election Science Team. Demographic inputs come from the U.S. Census Bureau (ACS 5-year estimates and the 2020 Decennial Census). Health and environmental inputs come from the CDC (PLACES and the Environmental Justice Index). Land cover comes from the USGS and EPA. Election-day and lead-up weather come from PRISM 4km daily grids and the NOAA Global Historical Climatology Network. Mail-voting and election-administration patterns come from the MIT Election Lab's Survey of the Performance of American Elections. Block-group crime detail comes from CrimeGrade. Internet data and modeling support provided by ISPreports.org.
Modeling and analysis by the BestNeighborhood data science team. Full methodology and findings: political spectrum map.
Methodology reviewed by the BestNeighborhood data team. Last updated May 2026.