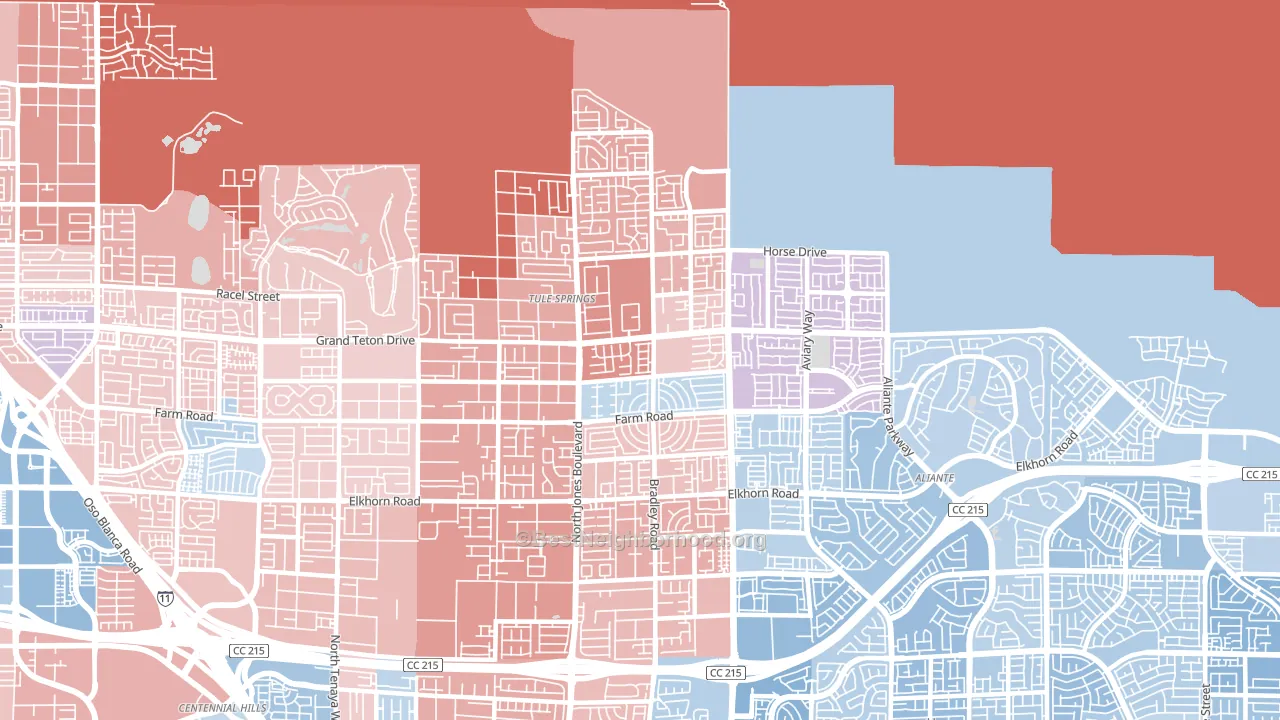
Sheep Mountain leans slightly Republican by roughly 12 points: about 44% of voters vote Democratic and 56% Republican.
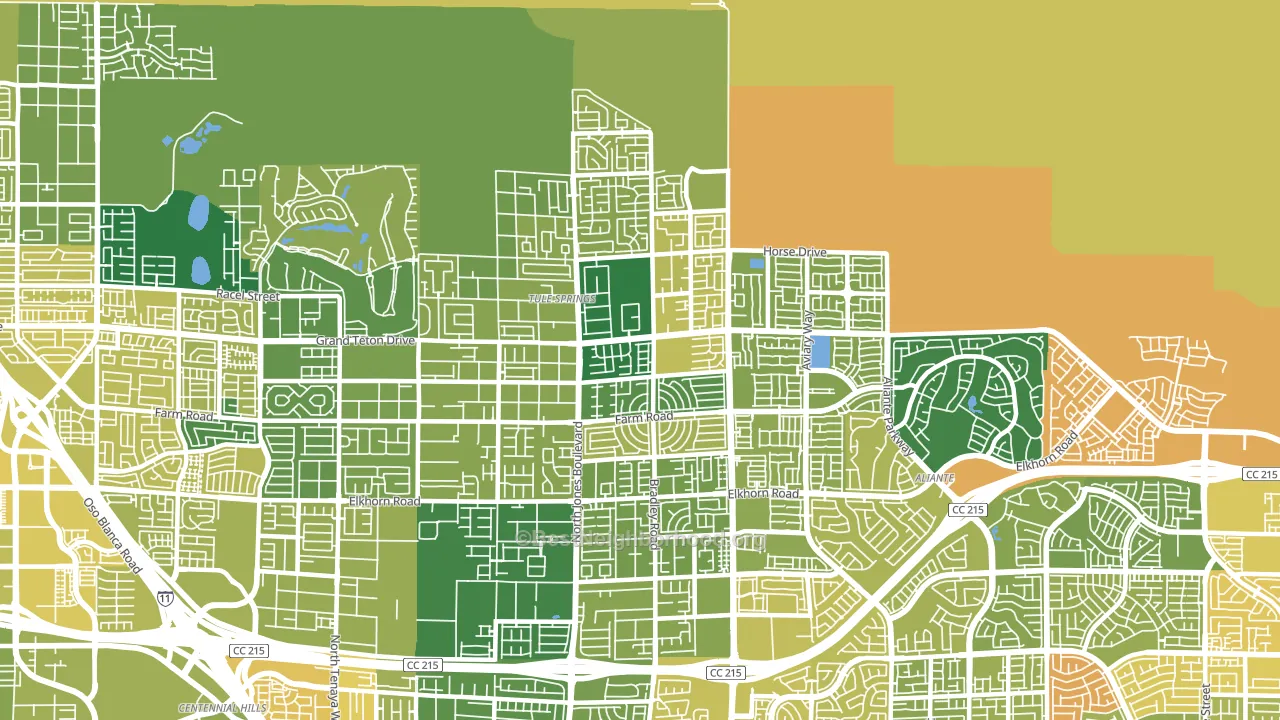
About 75% of adults in Sheep Mountain typically vote, above the U.S. average of about 62%. Among adults in Sheep Mountain, ~33% vote Democratic, ~42% Republican, and ~25% don't vote. The map below shows estimated turnout by block group.
How Sheep Mountain compares
Among neighborhoods within 5 miles, Sheep Mountain leans more Republican than 2 of 3 neighbors.
Sheep Mountain runs about 9 points more Republican than Nevada as a whole.
Politics vary noticeably by block within Sheep Mountain. The southwest side is the most Republican-leaning (R+17) and the east side is the least Republican-leaning (R+5), a spread of about 12 points.
Why Sheep Mountain leans the way it does
This analysis examined 14,881 data points per neighborhood to find what predicts political lean and turnout. The items below are a few correlations that stood out for Sheep Mountain, not a ranked or complete list of what matters most.
Car-dependent areas vote Republican. About 81% of residents in Sheep Mountain drive to work alone, about 8 points above the U.S. average of 74%. A high family-household share predicts Republican voting, and about 80% of households in Sheep Mountain are family households, above 86% of neighborhoods.
Homeownership and voter turnout
Places with homeowner-heavy households tend to turn out at a higher rate; Sheep Mountain, Las Vegas, NV sits in the top quarter nationally on this measure.
Why turnout in Sheep Mountain looks the way it does
Turnout in Sheep Mountain sits close to the national pattern. Routine healthcare access, homeownership, education, and food security all land near their national averages here. Learn more about the findings and methodology on the political spectrum map.
Nearby Neighborhoods
- Tule Springs, Las Vegas, NV R+13
- Centennial Hills, Las Vegas, NV Even
- North Cheyenne, Las Vegas, NV Even
- North Last Vegas, North Las Vegas, NV D+23
- Kyle Canyon, Las Vegas, NV Even
- Lone Mountain, Las Vegas, NV D+6
- Desert Shores, Las Vegas, NV D+22
- Michael Way, Las Vegas, NV D+22
- Vegas Heights, North Las Vegas, NV D+57
- The Pueblo, Las Vegas, NV D+13
Neighborhoods with Similar Populations
- Canyon Crest, Riverside, CA D+10
- Sunrise, Las Vegas, NV D+26
- Hunting Park, Philadelphia, PA D+64
- Harder-Tennyson, Hayward, CA D+37
- Stanford University, Stanford, CA D+64
- Queen Anne, Seattle, WA D+74
- Wicker Park, Chicago, IL D+71
- Central Boulder, Boulder, CO D+71
- Mount Greenwood, Chicago, IL R+26
- Richmond, Portland, OR D+87
Sources and methodology
Precinct-level voting records used to fit the model come from Nevada Secretary of State, Elections, distributed by the Voting and Election Science Team. Demographic inputs come from the U.S. Census Bureau (ACS 5-year estimates and the 2020 Decennial Census). Health and environmental inputs come from the CDC (PLACES and the Environmental Justice Index). Land cover comes from the USGS and EPA. Election-day and lead-up weather come from PRISM 4km daily grids and the NOAA Global Historical Climatology Network. Mail-voting and election-administration patterns come from the MIT Election Lab's Survey of the Performance of American Elections. Block-group crime detail comes from CrimeGrade. Internet data and modeling support provided by ISPreports.org.
Modeling and analysis by the BestNeighborhood data science team. Full methodology and findings: political spectrum map.
Methodology reviewed by the BestNeighborhood data team. Last updated May 2026.