Swissvale is a Democratic stronghold. About 82% of voters here vote Democratic and 18% Republican.
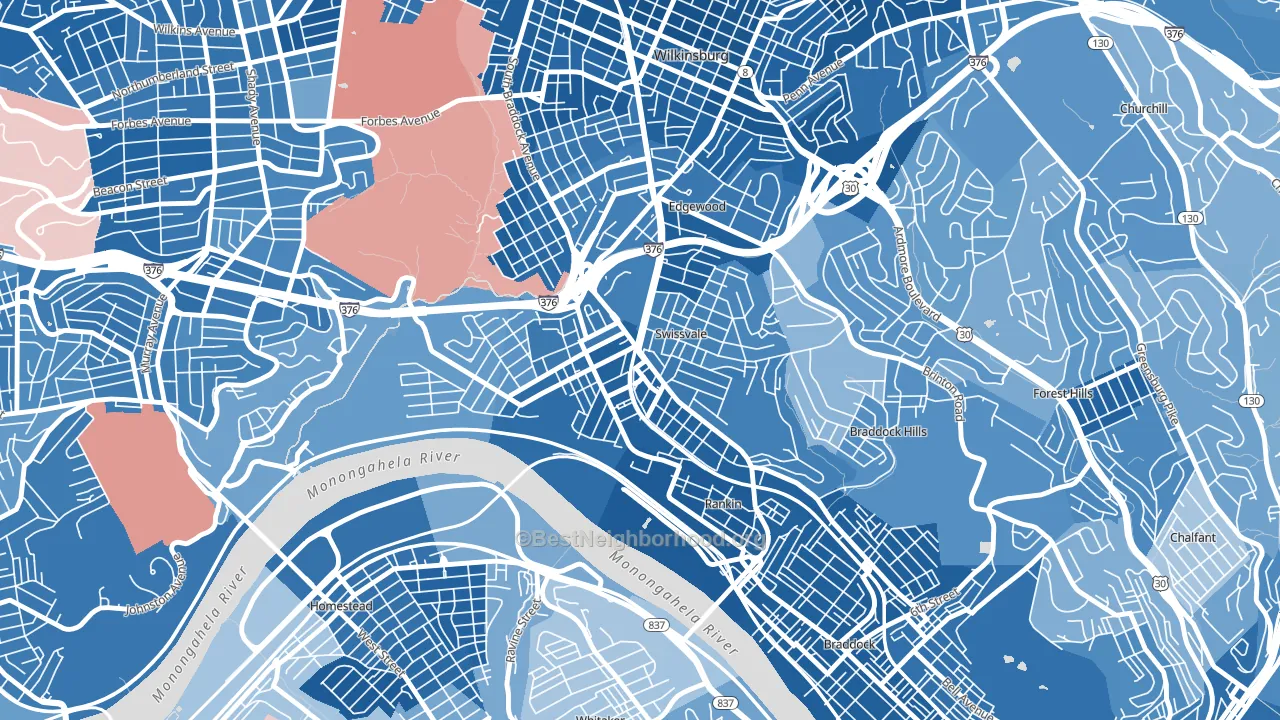
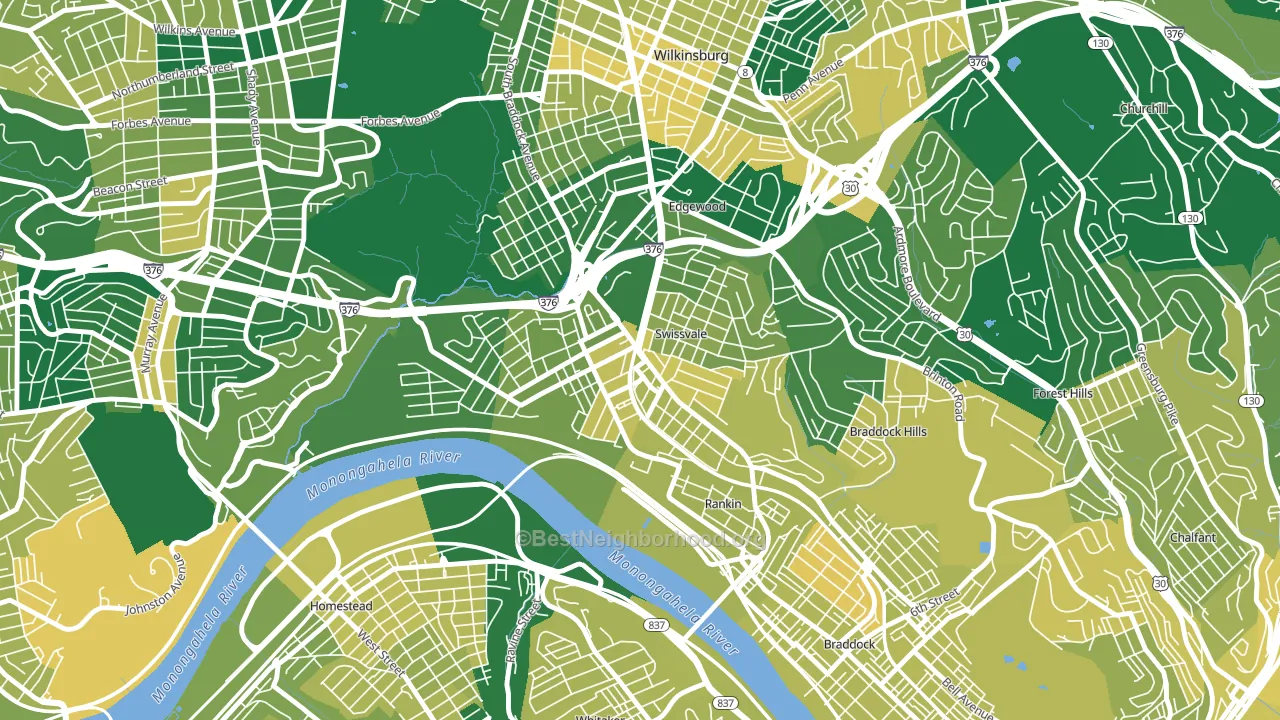
About 72% of adults in Swissvale typically vote, above the U.S. average of about 62%. Among adults in Swissvale, ~59% vote Democratic, ~13% Republican, and ~28% don't vote. The map below shows estimated turnout by block group.
How Swissvale compares
Among cities within 25 miles, Swissvale leans more Democratic than 253 of 257 neighbors.
Swissvale runs about 66 points more Democratic than Pennsylvania as a whole. Pennsylvania is roughly evenly split, and Swissvale sits clearly on the Democratic side.
Politics vary noticeably by neighborhood within Swissvale. The south side is the most Democratic-leaning (D+74) and the northeast side is the least Democratic-leaning (D+55), a spread of about 18 points.
Why Swissvale leans the way it does
This analysis examined 14,881 data points per city to find what predicts political lean and turnout. The items below are a few correlations that stood out for Swissvale, not a ranked or complete list of what matters most.
Dense areas vote Democratic. About 97% of residents in Swissvale live in densely developed areas, about 60 points above the U.S. average of 36%. High college attainment predicts Democratic voting, and Swissvale sits in the top quarter (about 43%, above 89% of cities). Swissvale runs against the grain of Pennsylvania, a Democratic-leaning outlier in a roughly evenly split state.
Population density and Democratic lean
Places with high population density tend to lean Democratic; Swissvale, PA sits in the top tenth nationally on this measure.
Why turnout in Swissvale looks the way it does
Areas with high high-school completion turn out at higher rates. About 97% of adults in Swissvale have completed high school, about 6 points above the Pennsylvania average of 91%. Learn more about the findings and methodology on the political spectrum map.
Nearby Cities
- Edgewood, PA D+69
- Rankin, PA D+76
- Braddock Hills, PA D+39
- Braddock, PA D+78
- Wilkinsburg, PA D+80
- Whitaker, PA D+10
- Forest Hills, PA D+47
- North Braddock, PA D+51
- Homestead, PA D+49
- Munhall, PA D+17
Cities with Similar Populations
- Ahoskie, NC D+33
- Dalzell, SC D+2
- Mountain View, HI D+20
- Lawrence, NY R+56
- Sitka, AK D+14
- Upper Sandusky, OH R+47
- Camilla, GA D+11
- Boulder Hill, IL D+7
- Elmsford, NY D+36
- La Grange, TX R+45
Sources and methodology
Precinct-level voting records used to fit the model come from Pennsylvania Department of State, Bureau of Elections, distributed by the Voting and Election Science Team. Demographic inputs come from the U.S. Census Bureau (ACS 5-year estimates and the 2020 Decennial Census). Health and environmental inputs come from the CDC (PLACES and the Environmental Justice Index). Land cover comes from the USGS and EPA. Election-day and lead-up weather come from PRISM 4km daily grids and the NOAA Global Historical Climatology Network. Mail-voting and election-administration patterns come from the MIT Election Lab's Survey of the Performance of American Elections. Block-group crime detail comes from CrimeGrade. Internet data and modeling support provided by ISPreports.org.
Modeling and analysis by the BestNeighborhood data science team. Full methodology and findings: political spectrum map.
Methodology reviewed by the BestNeighborhood data team. Last updated May 2026.