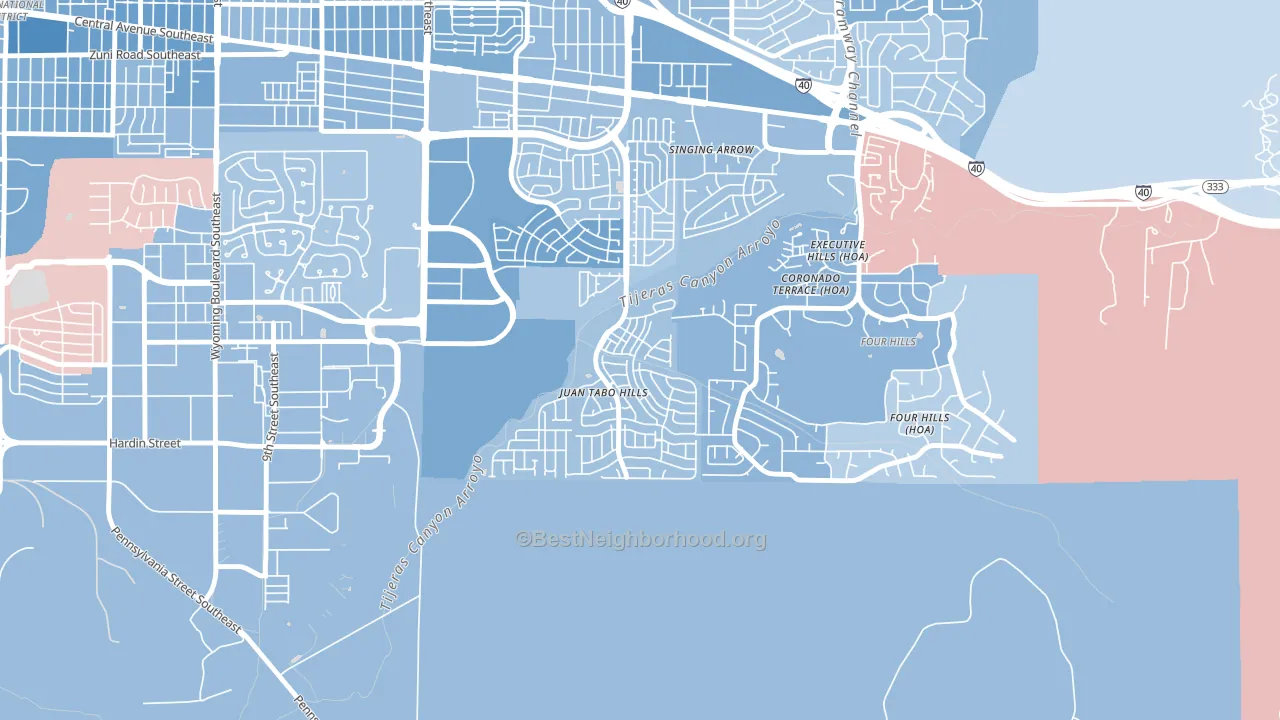
Tijeras Arroyo leans Democratic by roughly 18 points: about 59% of voters vote Democratic and 41% Republican.
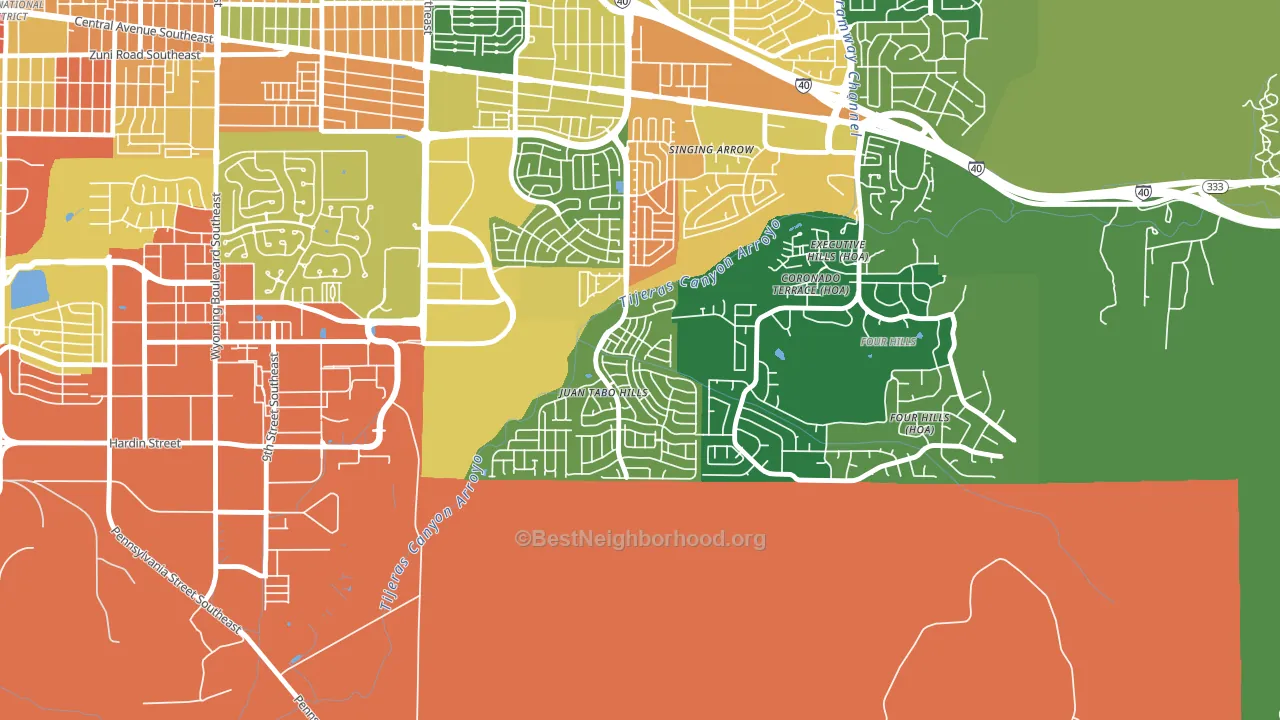
About 79% of adults in Tijeras Arroyo typically vote, above the U.S. average of about 62%. Among adults in Tijeras Arroyo, ~47% vote Democratic, ~32% Republican, and ~21% don't vote. The map below shows estimated turnout by block group.
How Tijeras Arroyo compares
Among neighborhoods within 5 miles, Tijeras Arroyo is the least Democratic-leaning.
Tijeras Arroyo runs about 11 points more Democratic than New Mexico as a whole.
Politics vary noticeably by block within Tijeras Arroyo. The south side is the most Democratic-leaning (D+20) and the northeast side is the least Democratic-leaning (D+8), a spread of about 13 points.
Why Tijeras Arroyo leans the way it does
Density, race composition, education, and family structure all sit close to their national averages in Tijeras Arroyo. The lean here lands roughly where demographic data alone would predict.
Population density and Democratic lean
Places with high population density tend to lean Democratic; Tijeras Arroyo, Albuquerque, NM sits above the national average on this measure.
Why turnout in Tijeras Arroyo looks the way it does
Areas with strong routine healthcare access turn out at higher rates. Tijeras Arroyo is in the top quarter nationally for routine-care measures such as insurance coverage, preventive screenings, and dental visits. The dental-visit rate here is about 72%, about 12 points above the U.S. average of 60%. Homeowners vote more often than renters, and about 92% of households in Tijeras Arroyo own their home, compared to around 49% in nearby neighborhoods. Learn more about the findings and methodology on the political spectrum map.
Nearby Neighborhoods
- Singing Arrow, Albuquerque, NM D+20
- South Los Altos, Albuquerque, NM D+25
- Princess Jeanne, Albuquerque, NM D+17
- Trumbull Village, Albuquerque, NM D+23
- Embudo Canyon, Albuquerque, NM D+20
- La Mesa, Albuquerque, NM D+33
- South San Pedro, Albuquerque, NM D+30
- Uptown, Albuquerque, NM D+30
- Se Heights, Albuquerque, NM D+55
- Nob Hill, Albuquerque, NM D+72
Neighborhoods with Similar Populations
- Garment District, Manhattan, NY D+63
- Italian Village, Columbus, OH D+53
- Green Island, Worcester, MA D+33
- Zenith, Des Moines, WA D+29
- Allendale-Lakeside, Shreveport, LA D+86
- Houston Farms, Houston, TX Even
- Dillard, New Orleans, LA D+82
- Forest Hills, Jamaica Plain, MA D+68
- Sam Hughes, Tucson, AZ D+59
- Civano, Tucson, AZ Even
Sources and methodology
Precinct-level voting records used to fit the model come from New Mexico Secretary of State, Bureau of Elections, distributed by the Voting and Election Science Team. Demographic inputs come from the U.S. Census Bureau (ACS 5-year estimates and the 2020 Decennial Census). Health and environmental inputs come from the CDC (PLACES and the Environmental Justice Index). Land cover comes from the USGS and EPA. Election-day and lead-up weather come from PRISM 4km daily grids and the NOAA Global Historical Climatology Network. Mail-voting and election-administration patterns come from the MIT Election Lab's Survey of the Performance of American Elections. Block-group crime detail comes from CrimeGrade. Internet data and modeling support provided by ISPreports.org.
Modeling and analysis by the BestNeighborhood data science team. Full methodology and findings: political spectrum map.
Methodology reviewed by the BestNeighborhood data team. Last updated May 2026.