Princess Jeanne leans Democratic by roughly 18 points: about 59% of voters vote Democratic and 41% Republican.
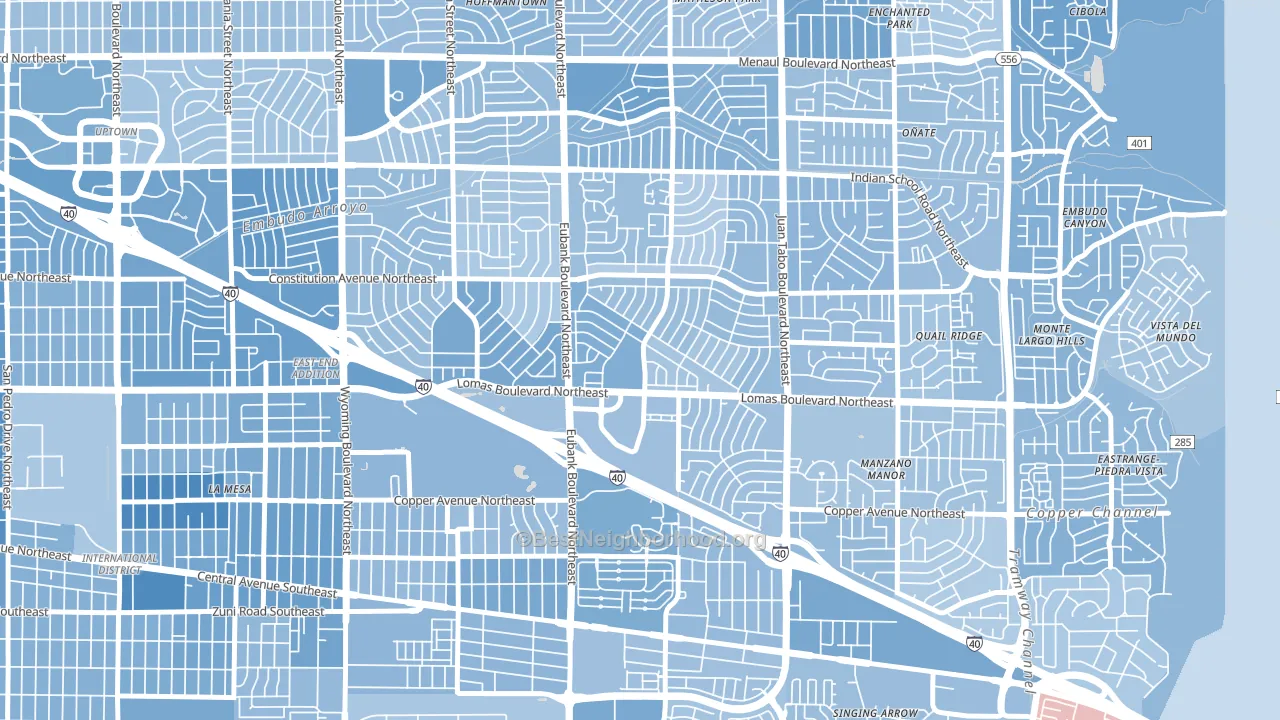
About 57% of adults in Princess Jeanne typically vote, near the U.S. average of about 62%. Among adults in Princess Jeanne, ~34% vote Democratic, ~23% Republican, and ~43% don't vote. The map below shows estimated turnout by block group.

How Princess Jeanne compares
Among neighborhoods within 5 miles, Princess Jeanne leans more Democratic than 2 of 14 neighbors.
Princess Jeanne runs about 11 points more Democratic than New Mexico as a whole.
Why Princess Jeanne leans the way it does
Density, race composition, education, and family structure all sit close to their national averages in Princess Jeanne. The lean here lands roughly where demographic data alone would predict.
Population density and Democratic lean
Places with high population density tend to lean Democratic; Princess Jeanne, Albuquerque, NM sits in the top quarter nationally on this measure.
Why turnout in Princess Jeanne looks the way it does
Turnout in Princess Jeanne sits close to the national pattern. Routine healthcare access, homeownership, education, and food security all land near their national averages here. Learn more about the findings and methodology on the political spectrum map.
Nearby Neighborhoods
- South Los Altos, Albuquerque, NM D+25
- La Mesa, Albuquerque, NM D+33
- Embudo Canyon, Albuquerque, NM D+20
- Singing Arrow, Albuquerque, NM D+20
- Trumbull Village, Albuquerque, NM D+23
- Uptown, Albuquerque, NM D+30
- Tijeras Arroyo, Albuquerque, NM D+17
- South San Pedro, Albuquerque, NM D+30
- Academy Hills Park, Albuquerque, NM D+13
- Nob Hill, Albuquerque, NM D+72
Neighborhoods with Similar Populations
- Silver Bow Park, Butte, MT Even
- Milneburg, New Orleans, LA D+77
- Dignowity Hill, San Antonio, TX D+42
- Pinewood-West Palm Beach, West Palm Beach, FL D+38
- Roselawn, Brighton, NY D+61
- Barry Harbour, Kansas City, MO D+13
- Elmhurst Park, Oakland, CA D+56
- Forestdale, Hammond, IN D+29
- Garden District, Baton Rouge, LA D+63
- Riviera Bay, St. Petersburg, FL R+7
Sources and methodology
Precinct-level voting records used to fit the model come from New Mexico Secretary of State, Bureau of Elections, distributed by the Voting and Election Science Team. Demographic inputs come from the U.S. Census Bureau (ACS 5-year estimates and the 2020 Decennial Census). Health and environmental inputs come from the CDC (PLACES and the Environmental Justice Index). Land cover comes from the USGS and EPA. Election-day and lead-up weather come from PRISM 4km daily grids and the NOAA Global Historical Climatology Network. Mail-voting and election-administration patterns come from the MIT Election Lab's Survey of the Performance of American Elections. Block-group crime detail comes from CrimeGrade. Internet data and modeling support provided by ISPreports.org.
Modeling and analysis by the BestNeighborhood data science team. Full methodology and findings: political spectrum map.
Methodology reviewed by the BestNeighborhood data team. Last updated May 2026.