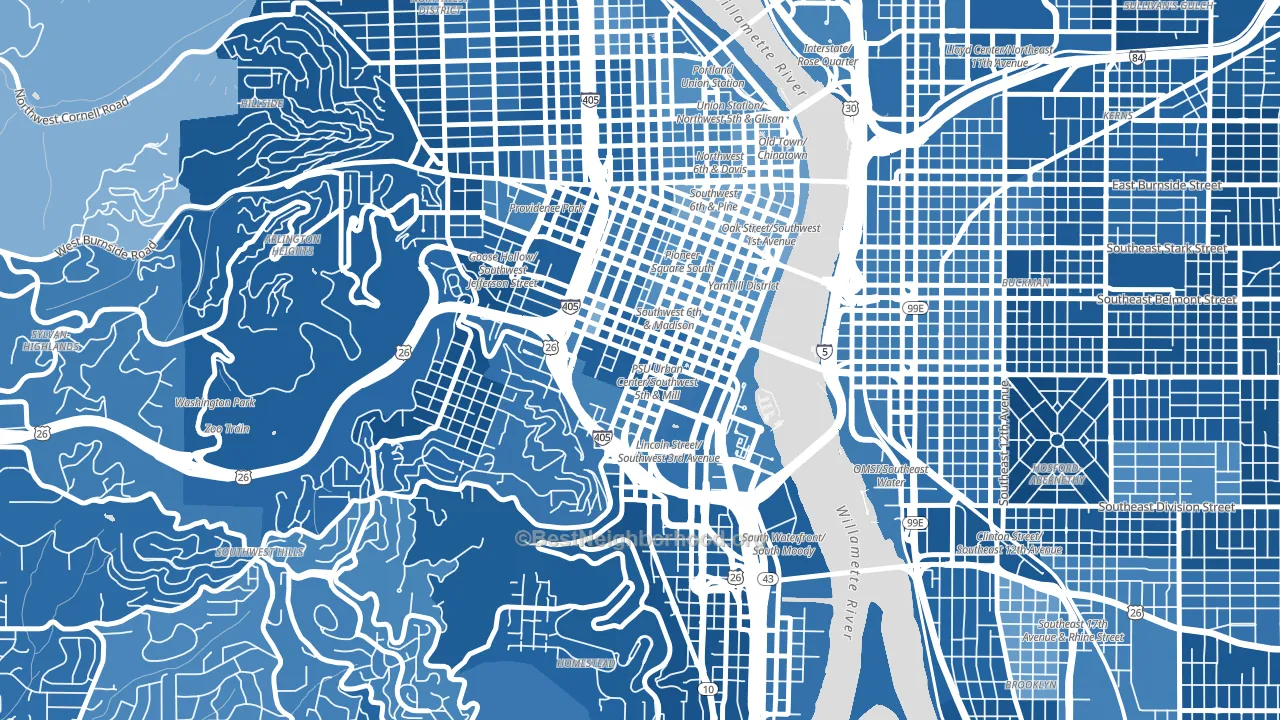
University District is a Democratic stronghold. About 81% of voters here vote Democratic and 19% Republican.
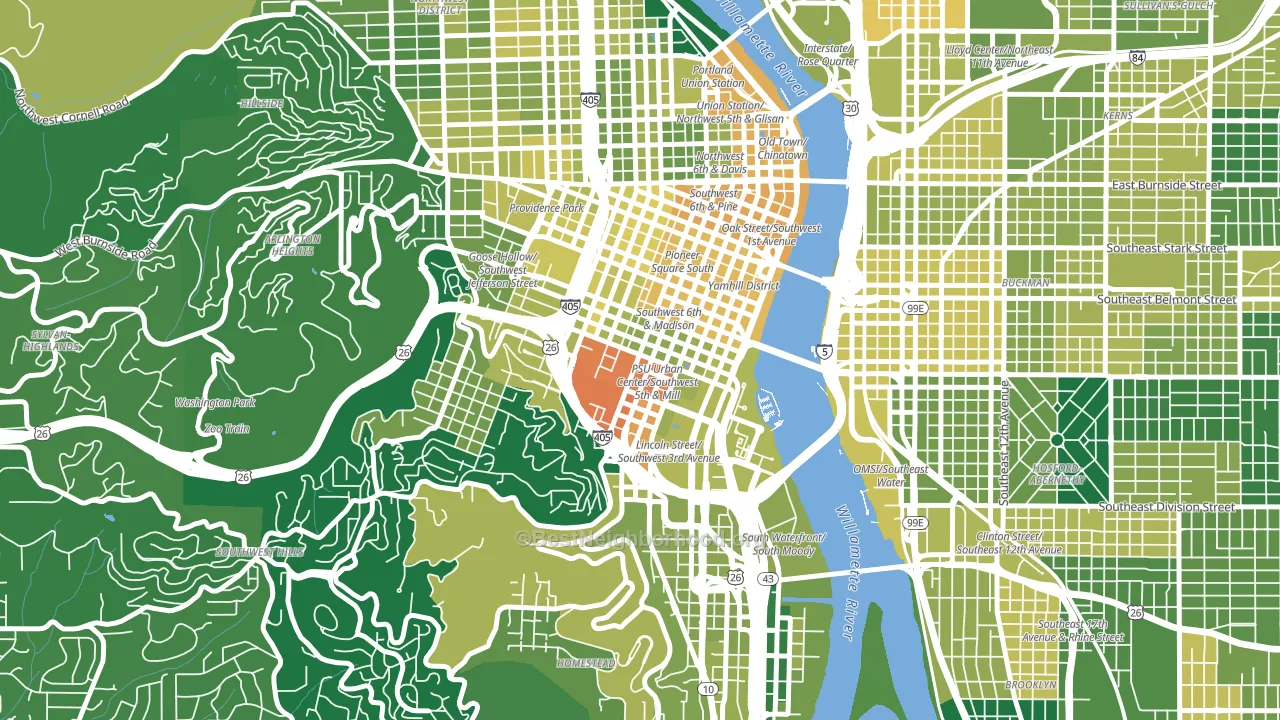
About 55% of adults in University District typically vote, below the U.S. average of about 62%. Among adults in University District, ~45% vote Democratic, ~10% Republican, and ~45% don't vote. The map below shows estimated turnout by block group.
How University District compares
Among neighborhoods within 5 miles, University District leans more Democratic than 10 of 47 neighbors.
University District runs about 48 points more Democratic than Oregon as a whole.
Politics vary noticeably by block within University District. The southeast side is the most Democratic-leaning (D+64) and the northeast side is the least Democratic-leaning (D+52), a spread of about 12 points.
Why University District leans the way it does
This analysis examined 14,881 data points per neighborhood to find what predicts political lean and turnout. The items below are a few correlations that stood out for University District, not a ranked or complete list of what matters most.
Areas with many never-married adults vote Democratic. About 60% of adults in University District have never been married, well above similar-sized neighborhoods (around 44%).
Paved land cover and Democratic lean
Places with extensive paved surfaces tend to lean Democratic; University District, Portland, OR sits in the top tenth nationally on this measure. Paved ground does not change how people vote; it mostly reflects how urban and built-up a place is.
Why turnout in University District looks the way it does
Renters vote less often than owners. About 87% of households in University District rent, about 62 points above the U.S. average of 25%. High-crime urban areas turn out at lower rates, and University District sits in the top 15% on a violent-crime measure. Learn more about the findings and methodology on the political spectrum map.
Nearby Neighborhoods
- Old Town-Chinatown, Portland, OR D+54
- Homestead, Portland, OR D+69
- Pearl District, Portland, OR D+63
- Northwest, Portland, OR D+77
- Southwest Hills, Portland, OR D+72
- Slabtown, Portland, OR D+78
- Buckman, Portland, OR D+80
- Corbett-Terwilliger-Lair Hill, Portland, OR D+68
- Hosford-Abernethy, Portland, OR D+81
- Brooklyn, Portland, OR D+81
Neighborhoods with Similar Populations
- Yorkshire, Charlotte, NC D+29
- Oceanway, Jacksonville, FL R+7
- Copperfield, Houston, TX R+4
- Grayland, Chicago, IL D+39
- Union Square, Somerville, MA D+75
- La Homa, Mission, TX R+4
- Outer Mission, San Francisco, CA D+48
- Northside Ann Arbor, Ann Arbor, MI D+73
- Glendale, Salt Lake City, UT D+24
- Seventh Avenue, Newark, NJ D+45
Sources and methodology
Precinct-level voting records used to fit the model come from Oregon Secretary of State, Elections Division, distributed by the Voting and Election Science Team. Demographic inputs come from the U.S. Census Bureau (ACS 5-year estimates and the 2020 Decennial Census). Health and environmental inputs come from the CDC (PLACES and the Environmental Justice Index). Land cover comes from the USGS and EPA. Election-day and lead-up weather come from PRISM 4km daily grids and the NOAA Global Historical Climatology Network. Mail-voting and election-administration patterns come from the MIT Election Lab's Survey of the Performance of American Elections. Block-group crime detail comes from CrimeGrade. Internet data and modeling support provided by ISPreports.org.
Modeling and analysis by the BestNeighborhood data science team. Full methodology and findings: political spectrum map.
Methodology reviewed by the BestNeighborhood data team. Last updated May 2026.