Walker's Point leans heavily Democratic by roughly 48 points: about 74% of voters vote Democratic and 26% Republican.

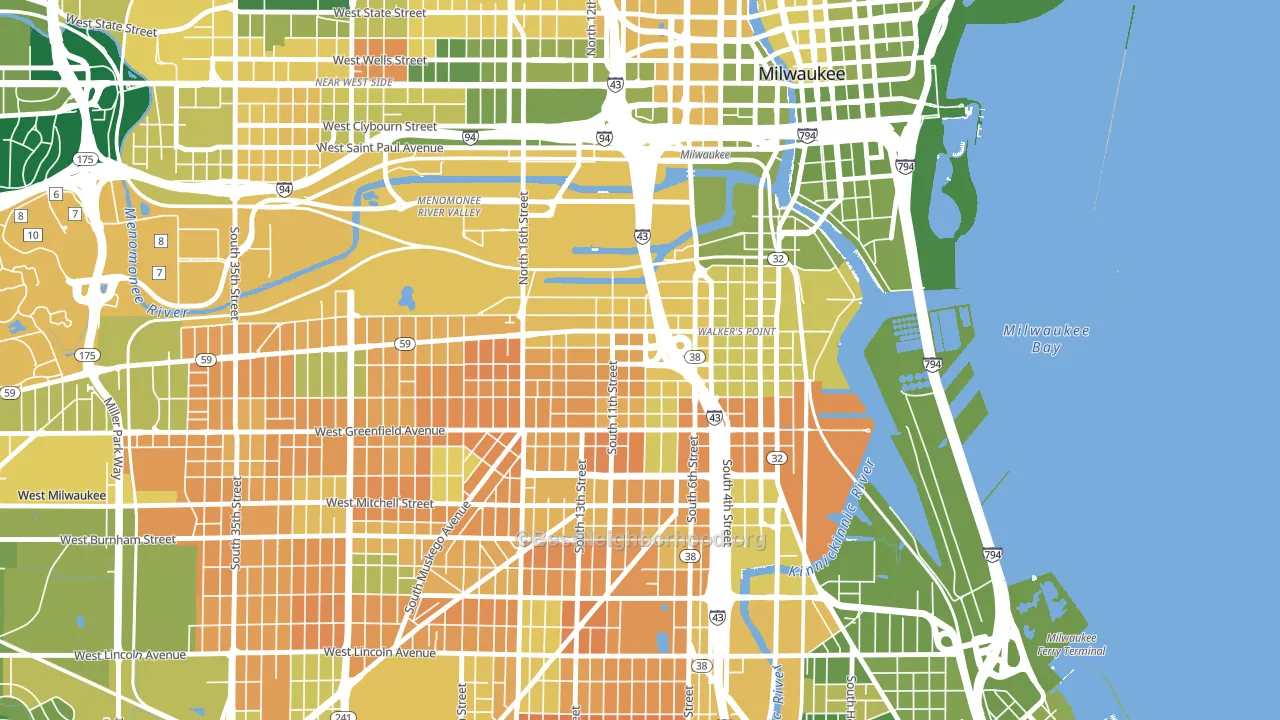
About 45% of adults in Walker's Point typically vote, below the U.S. average of about 62%. Among adults in Walker's Point, ~33% vote Democratic, ~12% Republican, and ~55% don't vote. The map below shows estimated turnout by block group.
How Walker's Point compares
Among neighborhoods within 5 miles, Walker's Point leans more Democratic than 22 of 48 neighbors.
Walker's Point runs about 49 points more Democratic than Wisconsin as a whole. Wisconsin is roughly evenly split, and Walker's Point sits clearly on the Democratic side.
Politics vary noticeably by block within Walker's Point. The east side is the most Democratic-leaning (D+61) and the southwest side is the least Democratic-leaning (D+42), a spread of about 18 points.
Why Walker's Point leans the way it does
This analysis examined 14,881 data points per neighborhood to find what predicts political lean and turnout. The items below are a few correlations that stood out for Walker's Point, not a ranked or complete list of what matters most.
Walker's Point votes against the grain of Wisconsin. Wisconsin is roughly evenly split, while Walker's Point runs about 49 points more Democratic. A high never-married share predicts Democratic voting, and about 51% of adults in Walker's Point have never been married, above 83% of neighborhoods.
Paved land cover and Democratic lean
Places with extensive paved surfaces tend to lean Democratic; Walker's Point, Milwaukee, WI sits in the top tenth nationally on this measure. Paved ground does not change how people vote; it mostly reflects how urban and built-up a place is.
Why turnout in Walker's Point looks the way it does
Areas with limited routine healthcare access turn out at lower rates. Walker's Point is in the bottom quarter nationally for routine-care measures such as insurance coverage, preventive screenings, and dental visits. The dental-visit rate here is about 47%, about 20 points below the Wisconsin average of 66%. Renters vote less often than owners, and about 72% of households in Walker's Point rent, about 47 points above the U.S. average of 25%. High food insecurity lines up with lower turnout, and about 41% of adults in Walker's Point report food insecurity, above 94% of neighborhoods. Learn more about the findings and methodology on the political spectrum map.
Nearby Neighborhoods
- Historic Mitchell Street, Milwaukee, WI D+43
- Clarke Square, Milwaukee, WI D+46
- Muskego Way, Milwaukee, WI D+40
- Kilbourn Town, Milwaukee, WI D+57
- Lincoln Village, Milwaukee, WI D+42
- Avenues West, Milwaukee, WI D+52
- Forest Home Hills, Milwaukee, WI D+40
- Silver City, Milwaukee, WI D+38
- Burnham Park, Milwaukee, WI D+36
- Juneau Town, Milwaukee, WI D+48
Neighborhoods with Similar Populations
- The Pueblo, Las Vegas, NV D+13
- West Highland, Denver, CO D+65
- Glen Iris, Birmingham, AL D+56
- Bon Air, Louisville, KY D+31
- Boise, Portland, OR D+81
- International District, Seattle, WA D+61
- Chicot West, Little Rock, AR D+46
- Gentilly Terrace, New Orleans, LA D+75
- Victoria Park, Fort Lauderdale, FL D+6
- Pico-Lowell, Santa Ana, CA D+34
Sources and methodology
Precinct-level voting records used to fit the model come from Wisconsin Elections Commission, distributed by the Voting and Election Science Team. Demographic inputs come from the U.S. Census Bureau (ACS 5-year estimates and the 2020 Decennial Census). Health and environmental inputs come from the CDC (PLACES and the Environmental Justice Index). Land cover comes from the USGS and EPA. Election-day and lead-up weather come from PRISM 4km daily grids and the NOAA Global Historical Climatology Network. Mail-voting and election-administration patterns come from the MIT Election Lab's Survey of the Performance of American Elections. Block-group crime detail comes from CrimeGrade. Internet data and modeling support provided by ISPreports.org.
Modeling and analysis by the BestNeighborhood data science team. Full methodology and findings: political spectrum map.
Methodology reviewed by the BestNeighborhood data team. Last updated May 2026.