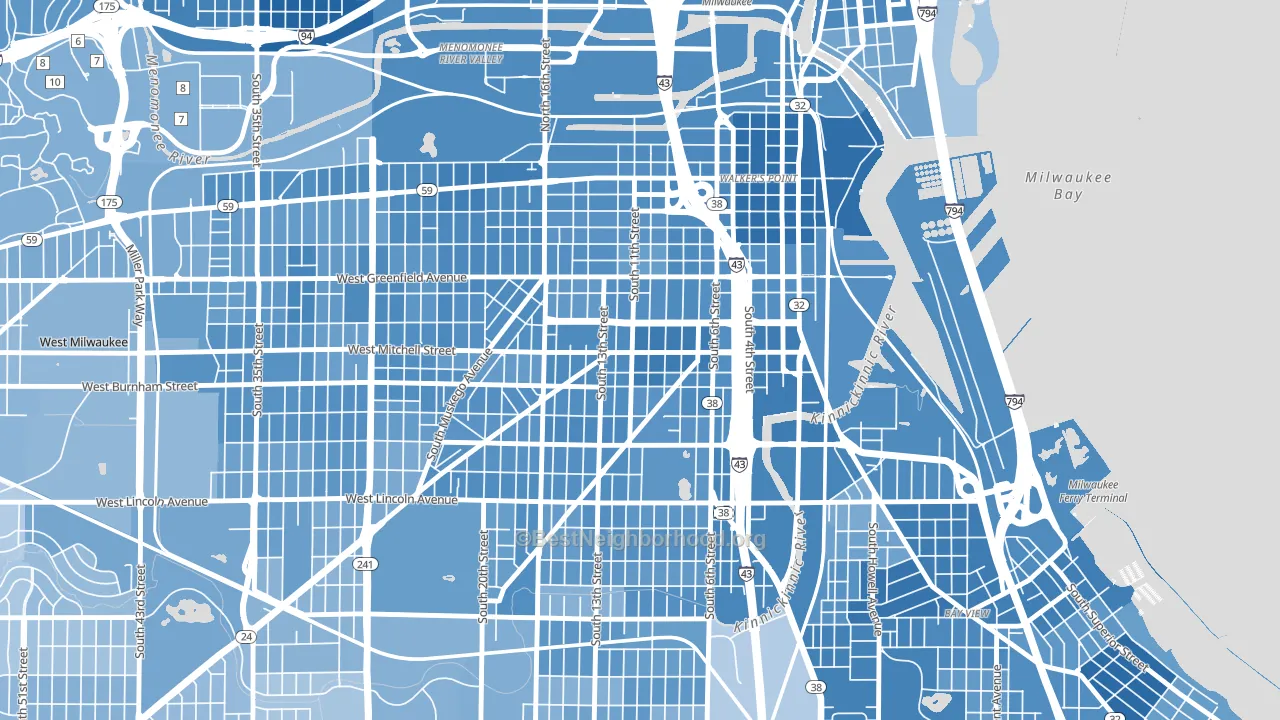
Historic Mitchell Street leans heavily Democratic by roughly 42 points: about 71% of voters vote Democratic and 29% Republican.
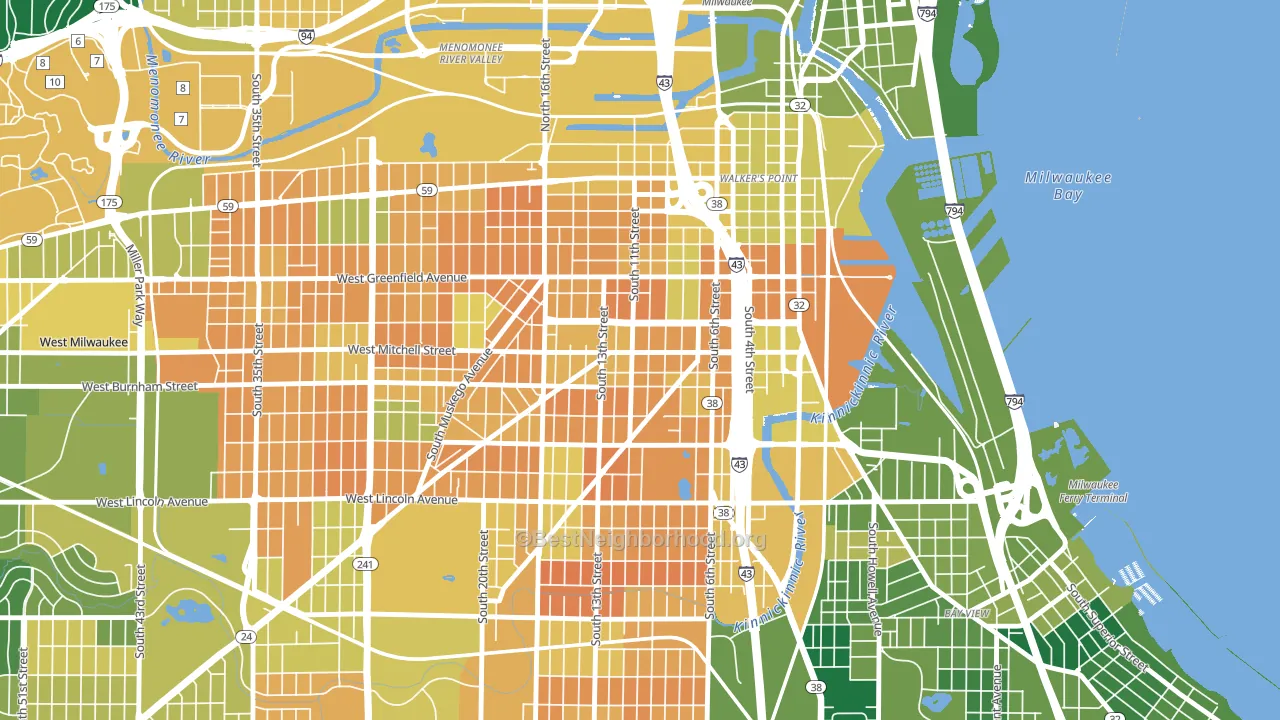
About 33% of adults in Historic Mitchell Street typically vote, below the U.S. average of about 62%. Among adults in Historic Mitchell Street, ~23% vote Democratic, ~10% Republican, and ~67% don't vote. The map below shows estimated turnout by block group.
How Historic Mitchell Street compares
Among neighborhoods within 5 miles, Historic Mitchell Street leans more Democratic than 19 of 43 neighbors.
Historic Mitchell Street runs about 44 points more Democratic than Wisconsin as a whole. Wisconsin is roughly evenly split, and Historic Mitchell Street sits clearly on the Democratic side.
Politics vary noticeably by block within Historic Mitchell Street. The east side is the most Democratic-leaning (D+49) and the north side is the least Democratic-leaning (D+38), a spread of about 11 points.
Why Historic Mitchell Street leans the way it does
This analysis examined 14,881 data points per neighborhood to find what predicts political lean and turnout. The items below are a few correlations that stood out for Historic Mitchell Street, not a ranked or complete list of what matters most.
Historic Mitchell Street votes against the grain of Wisconsin. Wisconsin is roughly evenly split, while Historic Mitchell Street runs about 44 points more Democratic. A high never-married share predicts Democratic voting, and about 55% of adults in Historic Mitchell Street have never been married, above 89% of neighborhoods.
Population density and Democratic lean
Places with high population density tend to lean Democratic; Historic Mitchell Street, Milwaukee, WI sits in the top tenth nationally on this measure.
Why turnout in Historic Mitchell Street looks the way it does
Areas with limited routine healthcare access turn out at lower rates. Historic Mitchell Street is in the bottom quarter nationally for routine-care measures such as insurance coverage, preventive screenings, and dental visits. The dental-visit rate here is about 38%, about 29 points below the Wisconsin average of 66%. Renters vote less often than owners, and about 74% of households in Historic Mitchell Street rent, compared to around 59% in nearby neighborhoods. High food insecurity lines up with lower turnout, and about 49% of adults in Historic Mitchell Street report food insecurity, above 98% of neighborhoods. Learn more about the findings and methodology on the political spectrum map.
Nearby Neighborhoods
- Walker's Point, Milwaukee, WI D+49
- Lincoln Village, Milwaukee, WI D+42
- Muskego Way, Milwaukee, WI D+40
- Forest Home Hills, Milwaukee, WI D+40
- Clarke Square, Milwaukee, WI D+46
- Polonia, Milwaukee, WI D+32
- Burnham Park, Milwaukee, WI D+36
- Layton Park, Milwaukee, WI D+31
- Silver City, Milwaukee, WI D+38
- Bay View, Milwaukee, WI D+51
Neighborhoods with Similar Populations
- Mission Grove, Riverside, CA Even
- North Arroyo, Pasadena, CA D+41
- North End, Fall River, MA D+4
- Willowbrook, Houston, TX D+28
- Elk Plain, Spanaway, WA R+13
- Saint Anthony, St. Paul, MN D+73
- Memorial Park, Santa Ana, CA D+31
- Mandarin, Jacksonville, FL R+38
- Allied Gardens, San Diego, CA D+25
- Prospect Lefferts Gardens, Brooklyn, NY D+84
Sources and methodology
Precinct-level voting records used to fit the model come from Wisconsin Elections Commission, distributed by the Voting and Election Science Team. Demographic inputs come from the U.S. Census Bureau (ACS 5-year estimates and the 2020 Decennial Census). Health and environmental inputs come from the CDC (PLACES and the Environmental Justice Index). Land cover comes from the USGS and EPA. Election-day and lead-up weather come from PRISM 4km daily grids and the NOAA Global Historical Climatology Network. Mail-voting and election-administration patterns come from the MIT Election Lab's Survey of the Performance of American Elections. Block-group crime detail comes from CrimeGrade. Internet data and modeling support provided by ISPreports.org.
Modeling and analysis by the BestNeighborhood data science team. Full methodology and findings: political spectrum map.
Methodology reviewed by the BestNeighborhood data team. Last updated May 2026.