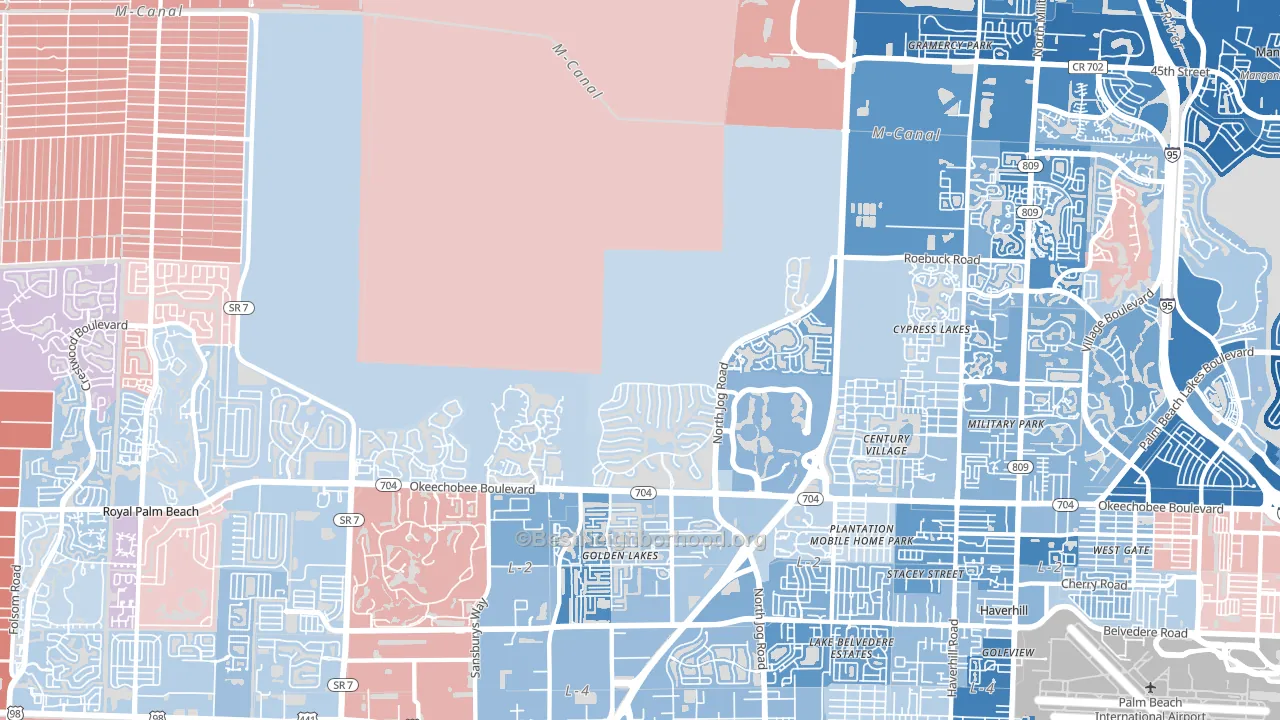
Water Catchment Area leans slightly Democratic by roughly 14 points: about 57% of voters vote Democratic and 43% Republican.
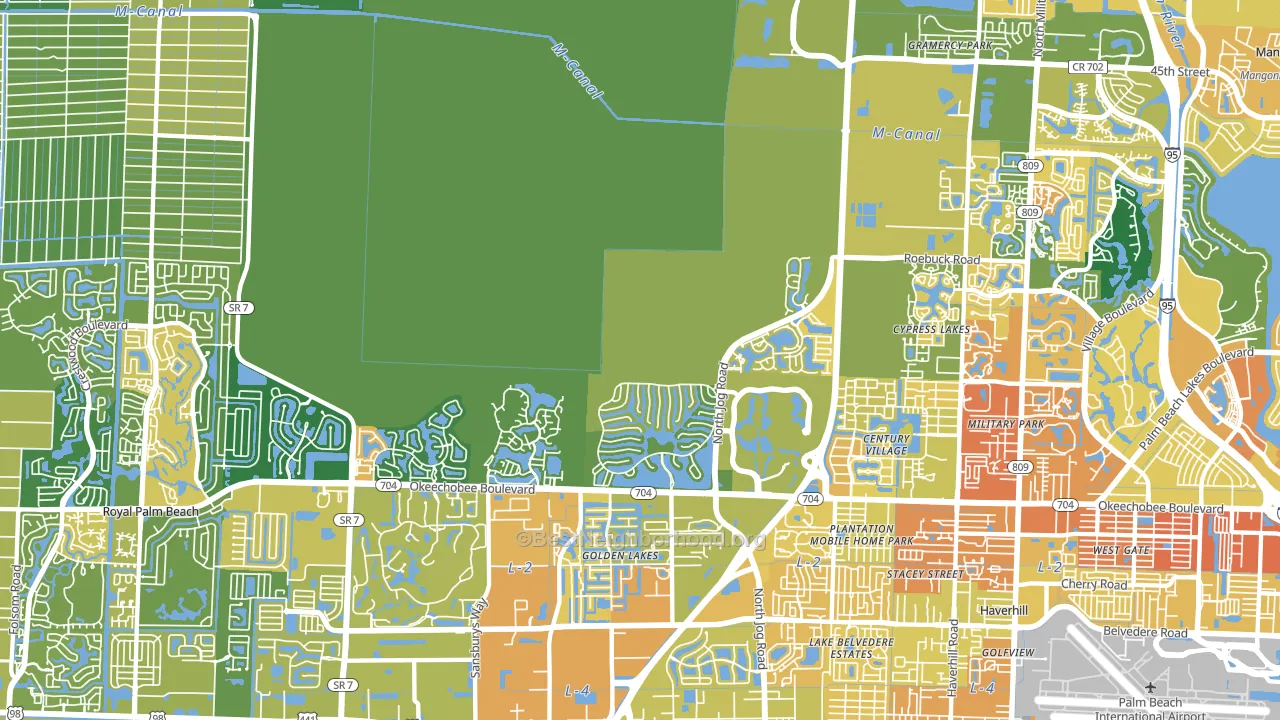
About 67% of adults in Water Catchment Area typically vote, near the U.S. average of about 62%. Among adults in Water Catchment Area, ~38% vote Democratic, ~29% Republican, and ~33% don't vote. The map below shows estimated turnout by block group.
How Water Catchment Area compares
Among neighborhoods within 5 miles, Water Catchment Area leans more Democratic than 1 of 4 neighbors.
Water Catchment Area runs about 27 points more Democratic than Florida as a whole. Florida leans Republican overall, while Water Catchment Area is one of the few Democratic-leaning pockets.
Politics vary noticeably by block within Water Catchment Area. The east side runs the most Democratic (D+28) and the north side runs the most Republican (R+6), a spread of about 34 points.
Why Water Catchment Area leans the way it does
This analysis examined 14,881 data points per neighborhood to find what predicts political lean and turnout. The items below are a few correlations that stood out for Water Catchment Area, not a ranked or complete list of what matters most.
Water Catchment Area votes against the grain of Florida. Florida leans Republican overall, while Water Catchment Area runs about 27 points more Democratic.
Population density and Democratic lean
Places with high population density tend to lean Democratic; Water Catchment Area, West Palm Beach, FL sits in the top quarter nationally on this measure.
Why turnout in Water Catchment Area looks the way it does
Turnout in Water Catchment Area sits close to the national pattern. Routine healthcare access, homeownership, education, and food security all land near their national averages here. Learn more about the findings and methodology on the political spectrum map.
Nearby Neighborhoods
- Century Village, West Palm Beach, FL D+11
- Palm Club Village, West Palm Beach, FL D+24
- Villages of Palm Beach Lakes, West Palm Beach, FL D+31
- Palm Beach Lakes, West Palm Beach, FL D+58
- Pineapple Park, West Palm Beach, FL R+10
- Olympia, Wellington, FL Even
- Northwood Hills, West Palm Beach, FL D+61
- South Shore of Wellington, Wellington, FL R+3
- Downtown West Palm Beach, West Palm Beach, FL D+10
- Pinewood-West Palm Beach, West Palm Beach, FL D+38
Neighborhoods with Similar Populations
- Govans, Baltimore, MD D+85
- Corlett, Cleveland, OH D+89
- Security, Security-Widefield, CO R+11
- Issaquah Highlands, Issaquah, WA D+45
- Longwood-Winton Grove, Hayward, CA D+37
- Addicks-Park ten, Houston, TX D+16
- Cooper Mountain Aloha South, Beaverton, OR D+28
- Ivey Ranch-Rancho del Oro, Oceanside, CA D+13
- Mount Airy, Cincinnati, OH D+58
- Kamuela, Waimea, HI D+24
Sources and methodology
Precinct-level voting records used to fit the model come from Florida Division of Elections, distributed by the Voting and Election Science Team. Demographic inputs come from the U.S. Census Bureau (ACS 5-year estimates and the 2020 Decennial Census). Health and environmental inputs come from the CDC (PLACES and the Environmental Justice Index). Land cover comes from the USGS and EPA. Election-day and lead-up weather come from PRISM 4km daily grids and the NOAA Global Historical Climatology Network. Mail-voting and election-administration patterns come from the MIT Election Lab's Survey of the Performance of American Elections. Block-group crime detail comes from CrimeGrade. Internet data and modeling support provided by ISPreports.org.
Modeling and analysis by the BestNeighborhood data science team. Full methodology and findings: political spectrum map.
Methodology reviewed by the BestNeighborhood data team. Last updated May 2026.