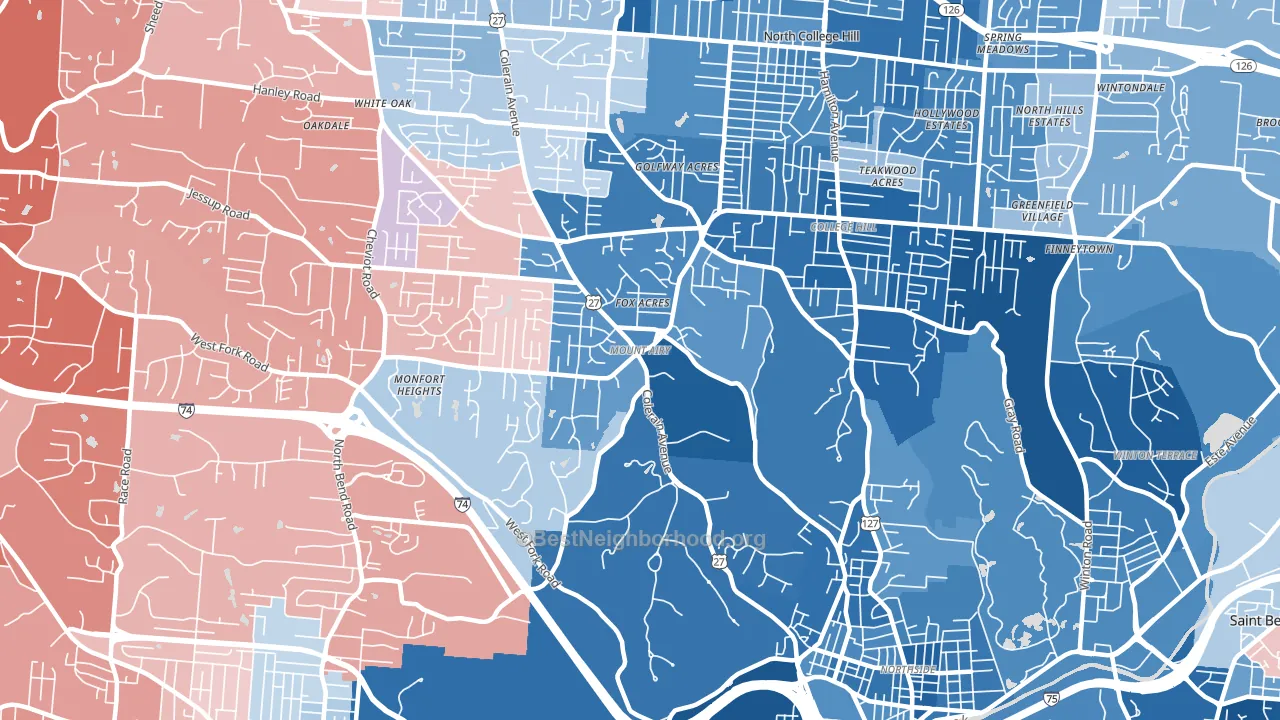
Mount Airy is a Democratic stronghold. About 79% of voters here vote Democratic and 21% Republican.
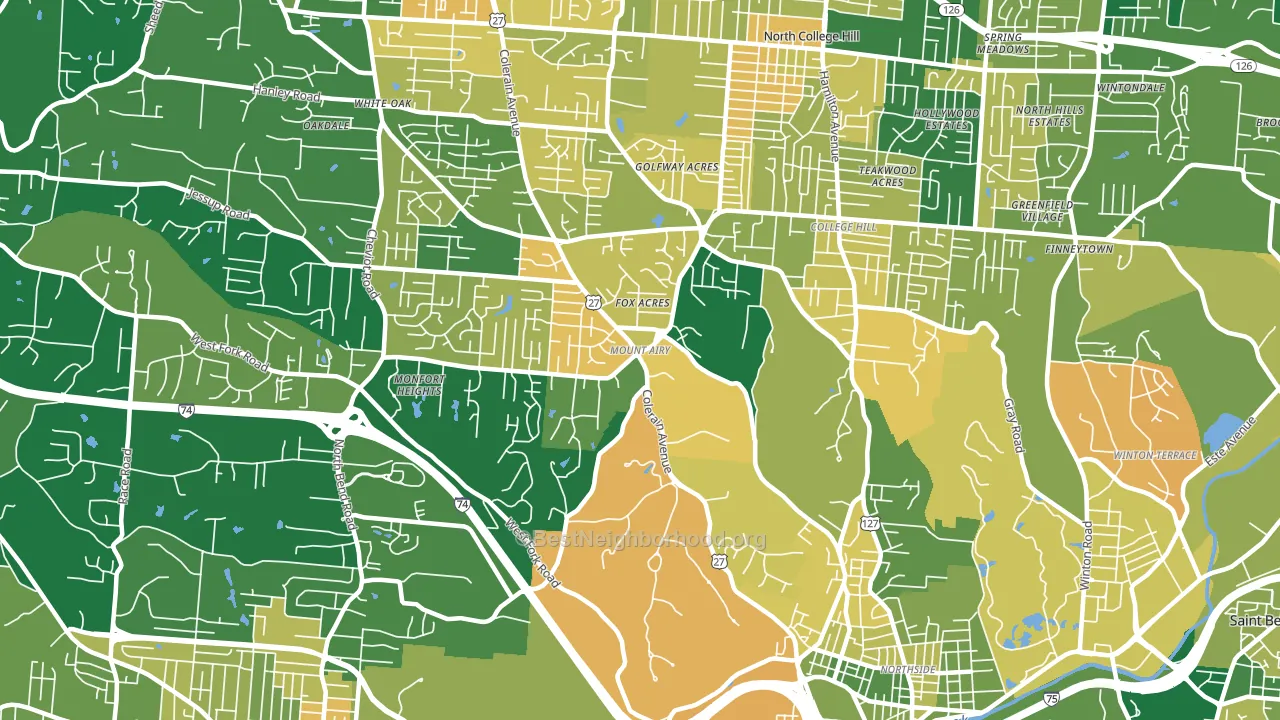
About 57% of adults in Mount Airy typically vote, near the U.S. average of about 62%. Among adults in Mount Airy, ~45% vote Democratic, ~12% Republican, and ~43% don't vote. The map below shows estimated turnout by block group.
How Mount Airy compares
Among neighborhoods within 5 miles, Mount Airy leans more Democratic than 8 of 13 neighbors.
Mount Airy runs about 69 points more Democratic than Ohio as a whole. Ohio leans Republican overall, while Mount Airy is one of the few Democratic-leaning pockets.
Politics vary noticeably by block within Mount Airy. The east side is the most Democratic-leaning (D+72) and the southwest side is the least Democratic-leaning (D+26), a spread of about 46 points.
Why Mount Airy leans the way it does
This analysis examined 14,881 data points per neighborhood to find what predicts political lean and turnout. The items below are a few correlations that stood out for Mount Airy, not a ranked or complete list of what matters most.
Mount Airy votes against the grain of Ohio. Ohio leans Republican overall, while Mount Airy runs about 69 points more Democratic. A high never-married share predicts Democratic voting, and about 51% of adults in Mount Airy have never been married, above 84% of neighborhoods.
Food insecurity and voter turnout
Places with high food insecurity tend to turn out at a lower rate; Mount Airy, Cincinnati, OH sits in the top quarter nationally on this measure. Food insecurity does not directly drive turnout; it reflects economic hardship, which lines up with lower voting.
Why turnout in Mount Airy looks the way it does
Renters vote less often than owners. About 63% of households in Mount Airy rent, about 38 points above the U.S. average of 25%. High food insecurity lines up with lower turnout, and about 32% of adults in Mount Airy report food insecurity, above 85% of neighborhoods. Low high-school completion lines up with lower turnout, and about 84% of adults in Mount Airy have completed high school, below 78% of neighborhoods. Learn more about the findings and methodology on the political spectrum map.
Nearby Neighborhoods
- College Hill, Cincinnati, OH D+61
- Monfort Heights South, Cincinnati, OH R+24
- Northside, Cincinnati, OH D+68
- Groesbeck, Cincinnati, OH R+4
- Winton Hills, Cincinnati, OH D+77
- East Westwood, Cincinnati, OH D+80
- Westwood, Cincinnati, OH D+46
- Northbrook, Cincinnati, OH D+29
- Clifton, Cincinnati, OH D+68
- Bridgetown North, Cincinnati, OH R+26
Neighborhoods with Similar Populations
- Kamuela, Waimea, HI D+24
- Mill Park, Portland, OR D+31
- Ivey Ranch-Rancho del Oro, Oceanside, CA D+13
- Issaquah Highlands, Issaquah, WA D+45
- Corlett, Cleveland, OH D+89
- Lower Highlands, Fall River, MA D+10
- Water Catchment Area, West Palm Beach, FL D+14
- Govans, Baltimore, MD D+85
- Security, Security-Widefield, CO R+11
- Longwood-Winton Grove, Hayward, CA D+37
Sources and methodology
Precinct-level voting records used to fit the model come from Ohio Secretary of State, Elections, distributed by the Voting and Election Science Team. Demographic inputs come from the U.S. Census Bureau (ACS 5-year estimates and the 2020 Decennial Census). Health and environmental inputs come from the CDC (PLACES and the Environmental Justice Index). Land cover comes from the USGS and EPA. Election-day and lead-up weather come from PRISM 4km daily grids and the NOAA Global Historical Climatology Network. Mail-voting and election-administration patterns come from the MIT Election Lab's Survey of the Performance of American Elections. Block-group crime detail comes from CrimeGrade. Internet data and modeling support provided by ISPreports.org.
Modeling and analysis by the BestNeighborhood data science team. Full methodology and findings: political spectrum map.
Methodology reviewed by the BestNeighborhood data team. Last updated May 2026.