Wayne County leans Republican by roughly 24 points: about 38% of voters vote Democratic and 62% Republican.
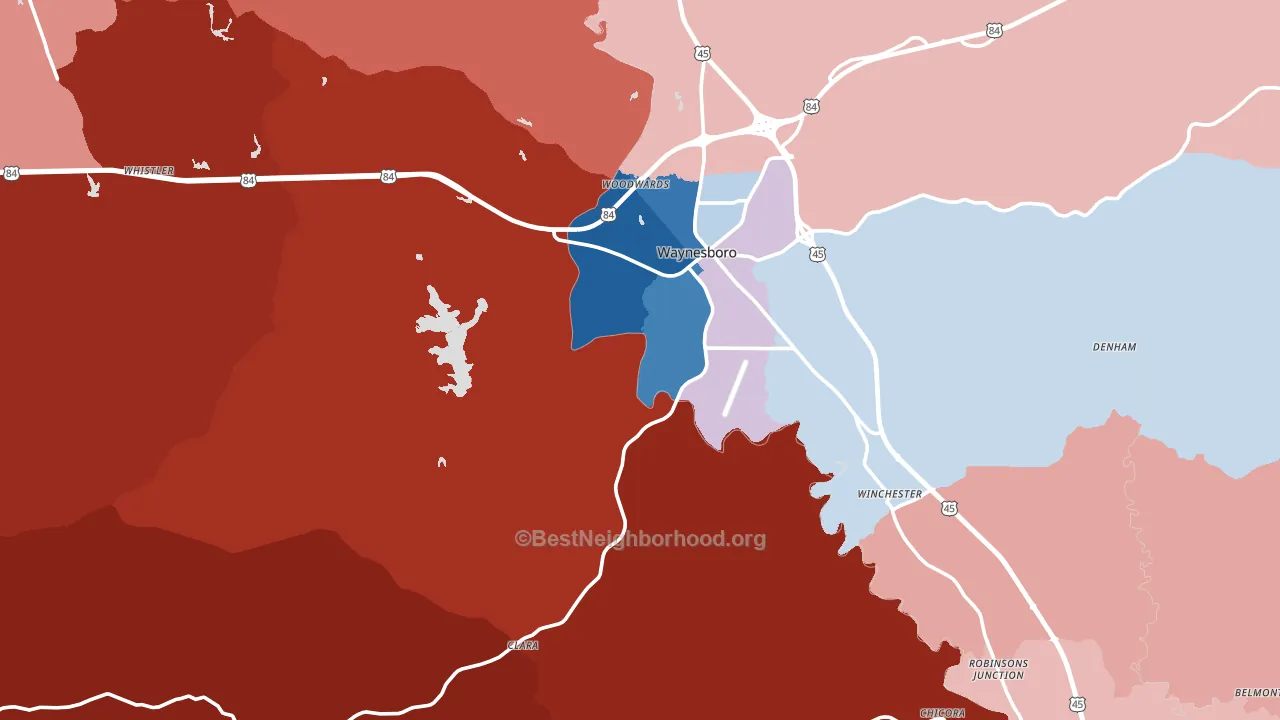
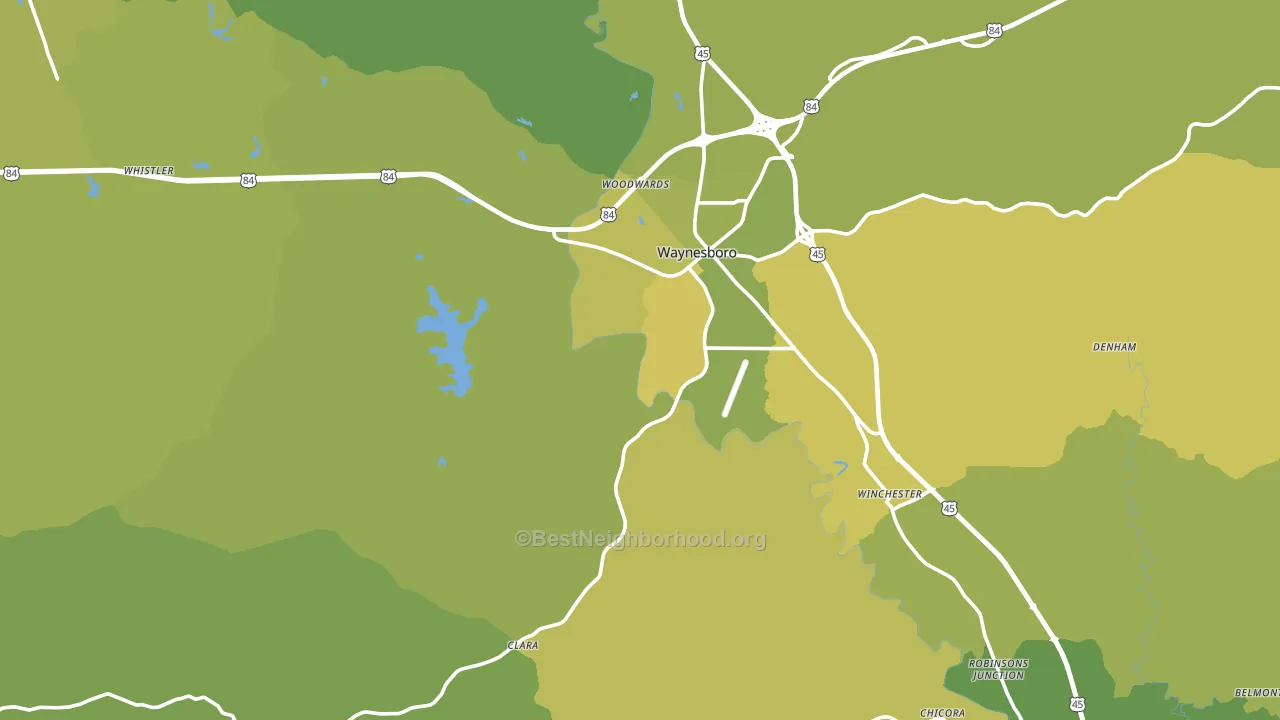
About 67% of adults in Wayne County typically vote, near the U.S. average of about 62%. Among adults in Wayne County, ~25% vote Democratic, ~41% Republican, and ~34% don't vote. The map below shows estimated turnout by block group.
How Wayne County compares
Among counties within 50 miles, Wayne County leans more Republican than 4 of 9 neighbors.
Politically, Wayne County sits close to the rest of Mississippi.
Politics vary noticeably by city within Wayne County. The southwest side is the most split-leaning (R+91) and the northeast side is the least split-leaning (R+3), a spread of about 89 points.
Why Wayne County leans the way it does
This analysis examined 14,881 data points per county to find what predicts political lean and turnout. The items below are a few correlations that stood out for Wayne County, not a ranked or complete list of what matters most.
Car-dependent areas vote Republican. About 85% of residents in Wayne County drive to work alone, about 12 points above the U.S. average of 74%.
Population density, never-married share, and Republican lean
Places that combine low population density and a never-married-heavy adult population tend to lean Republican, as Wayne County, MS does.
Why turnout in Wayne County looks the way it does
Homeowners vote more often than renters. About 84% of households in Wayne County own their home, about 8 points above the Mississippi average of 77%. Learn more about the findings and methodology on the political spectrum map.
Nearby Counties
- Clarke County, MS R+26
- Jones County, MS R+32
- Greene County, MS R+53
- Washington County, AL R+46
- Perry County, MS R+58
- Choctaw County, AL R+22
- Jasper County, MS D+2
- Forrest County, MS R+6
- Clarke County, AL R+14
- Lauderdale County, MS R+5
Counties with Similar Populations
- Franklin Parish, LA R+38
- Monroe County, AL R+23
- Plumas County, CA R+23
- Tyler County, TX R+70
- Union County, TN R+70
- Spencer County, IN R+49
- Douglas County, IL R+48
- DeWitt County, TX R+49
- Pierce County, GA R+71
- Vernon County, MO R+56
Sources and methodology
Precinct-level voting records used to fit the model come from Mississippi Secretary of State, Elections, distributed by the Voting and Election Science Team. Demographic inputs come from the U.S. Census Bureau (ACS 5-year estimates and the 2020 Decennial Census). Health and environmental inputs come from the CDC (PLACES and the Environmental Justice Index). Land cover comes from the USGS and EPA. Election-day and lead-up weather come from PRISM 4km daily grids and the NOAA Global Historical Climatology Network. Mail-voting and election-administration patterns come from the MIT Election Lab's Survey of the Performance of American Elections. Block-group crime detail comes from CrimeGrade. Internet data and modeling support provided by ISPreports.org.
Modeling and analysis by the BestNeighborhood data science team. Full methodology and findings: political spectrum map.
Methodology reviewed by the BestNeighborhood data team. Last updated May 2026.