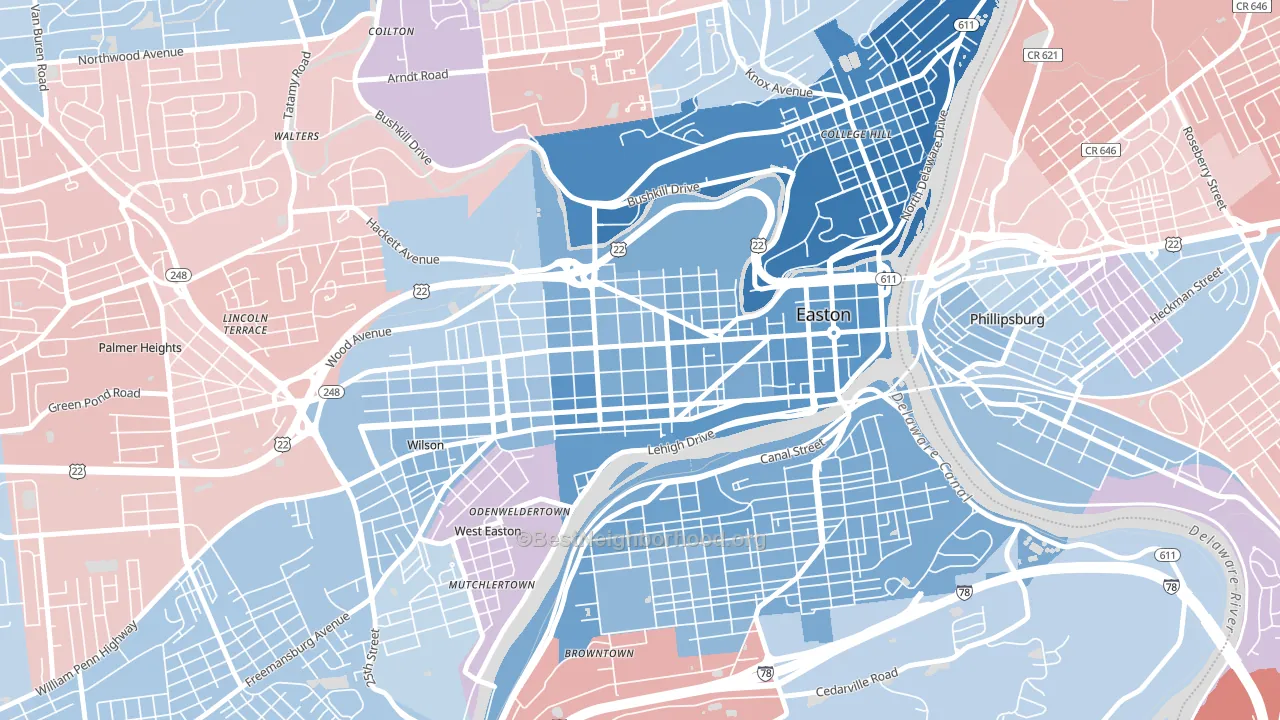
West Ward leans Democratic by roughly 26 points: about 63% of voters vote Democratic and 37% Republican.
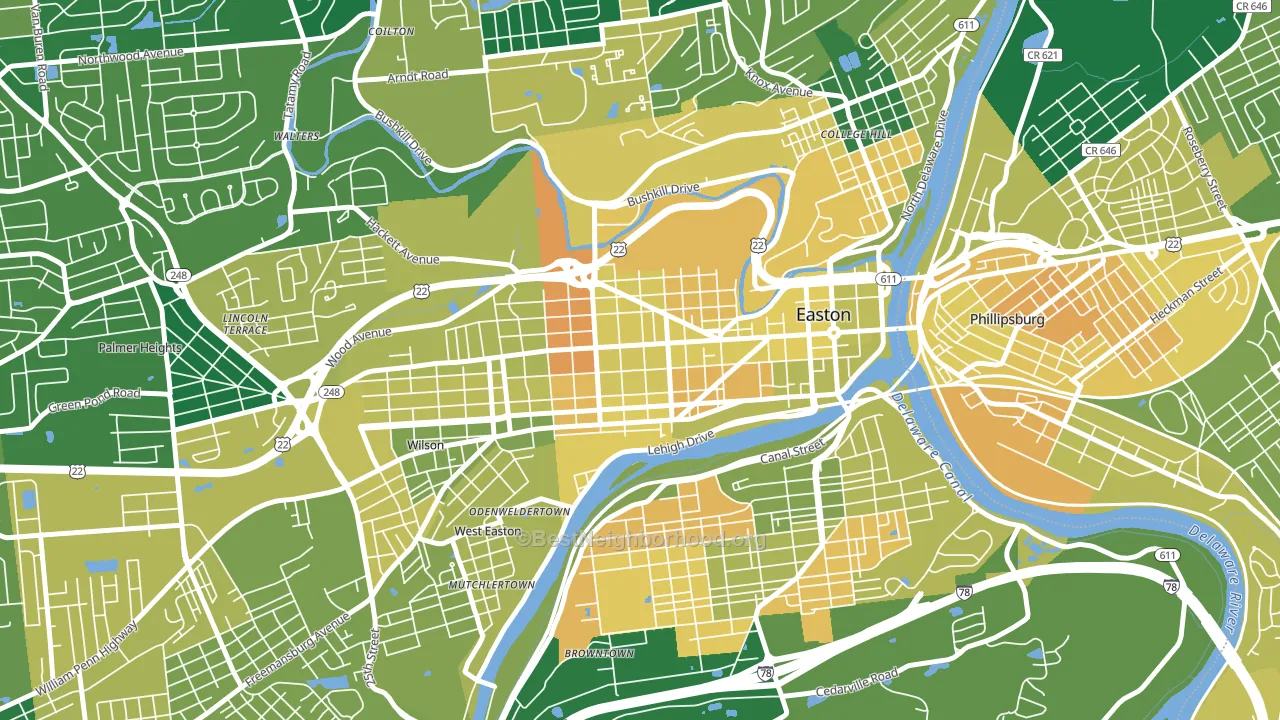
About 48% of adults in West Ward typically vote, below the U.S. average of about 62%. Among adults in West Ward, ~30% vote Democratic, ~18% Republican, and ~52% don't vote. The map below shows estimated turnout by block group.
How West Ward compares
Among neighborhoods within 5 miles, West Ward leans more Democratic than 3 of 5 neighbors.
West Ward runs about 28 points more Democratic than Pennsylvania as a whole. Pennsylvania is roughly evenly split, and West Ward sits clearly on the Democratic side.
Politics vary noticeably by block within West Ward. The southeast side is the most Democratic-leaning (D+35) and the west side is the least Democratic-leaning (D+20), a spread of about 15 points.
Why West Ward leans the way it does
This analysis examined 14,881 data points per neighborhood to find what predicts political lean and turnout. The items below are a few correlations that stood out for West Ward, not a ranked or complete list of what matters most.
Areas with many never-married adults vote Democratic. About 55% of adults in West Ward have never been married, modestly above similar-sized neighborhoods (around 44%). West Ward runs against the grain of Pennsylvania, a Democratic-leaning outlier in a roughly evenly split state.
Population density and Democratic lean
Places with high population density tend to lean Democratic; West Ward, Easton, PA sits in the top tenth nationally on this measure.
Why turnout in West Ward looks the way it does
Renters vote less often than owners. About 64% of households in West Ward rent, about 39 points above the U.S. average of 25%. High-crime urban areas turn out at lower rates, and West Ward sits in the top 15% on a violent-crime measure. Learn more about the findings and methodology on the political spectrum map.
Nearby Neighborhoods
- Southside, Easton, PA D+29
- College Hill, Easton, PA D+57
- North End, Phillipsburg, NJ D+6
- Firthtown, Phillipsburg, NJ D+8
- Palmer Heights, Easton, PA R+6
- middletown, Bethlehem, PA Even
- South Side, Bethlehem, PA D+33
- Sayre Park, Bethlehem, PA D+36
- West Bethlehem, Bethlehem, PA D+25
- Rittersville, Allentown, PA D+10
Neighborhoods with Similar Populations
- Silver Lakes, Pembroke Pines, FL D+16
- Rancho West, San Bernardino, CA D+18
- Far North Dallas-Richardson, Richardson, TX D+29
- Six Forks, Raleigh, NC D+27
- Como, St. Paul, MN D+61
- Fells Point, Baltimore, MD D+70
- Sterling Park, Sterling, VA D+23
- Greater Fifth Ward, Houston, TX D+63
- Aberdeen, Hampton, VA D+72
- Edison Historic District, Pomona, CA D+36
Sources and methodology
Precinct-level voting records used to fit the model come from Pennsylvania Department of State, Bureau of Elections, distributed by the Voting and Election Science Team. Demographic inputs come from the U.S. Census Bureau (ACS 5-year estimates and the 2020 Decennial Census). Health and environmental inputs come from the CDC (PLACES and the Environmental Justice Index). Land cover comes from the USGS and EPA. Election-day and lead-up weather come from PRISM 4km daily grids and the NOAA Global Historical Climatology Network. Mail-voting and election-administration patterns come from the MIT Election Lab's Survey of the Performance of American Elections. Block-group crime detail comes from CrimeGrade. Internet data and modeling support provided by ISPreports.org.
Modeling and analysis by the BestNeighborhood data science team. Full methodology and findings: political spectrum map.
Methodology reviewed by the BestNeighborhood data team. Last updated May 2026.