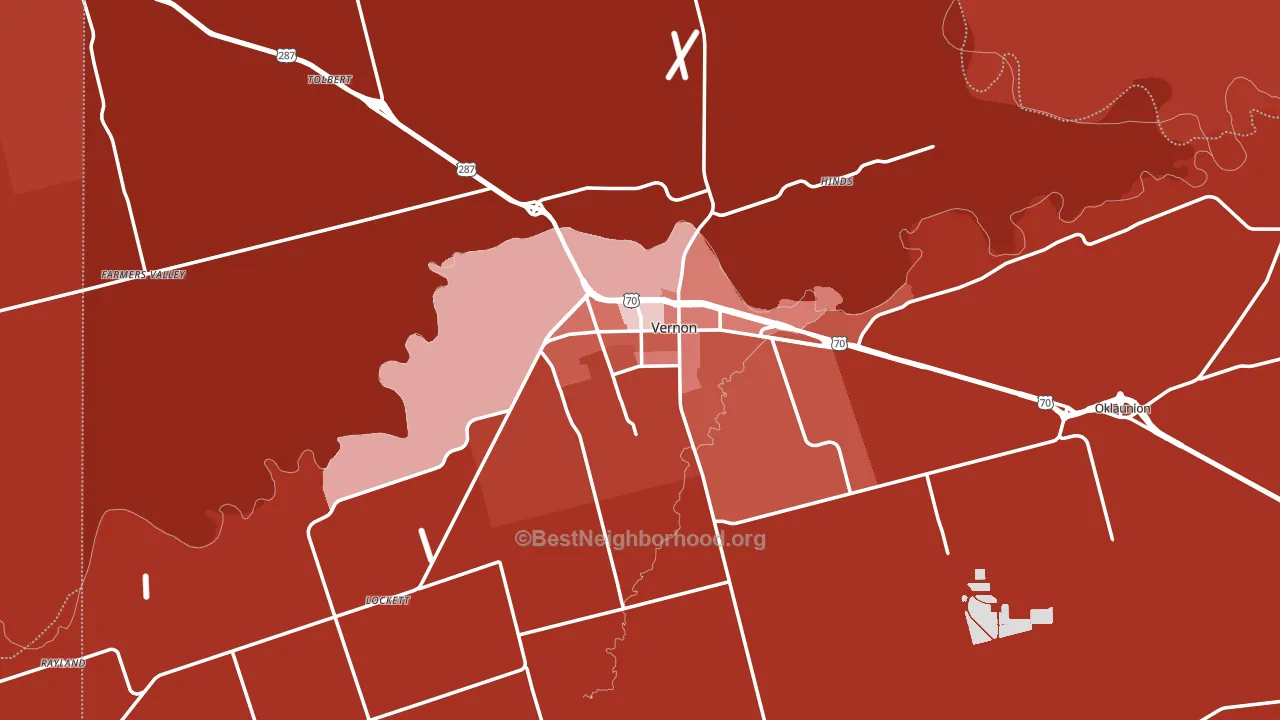
Wilbarger County leans heavily Republican by roughly 44 points: about 28% of voters vote Democratic and 72% Republican.
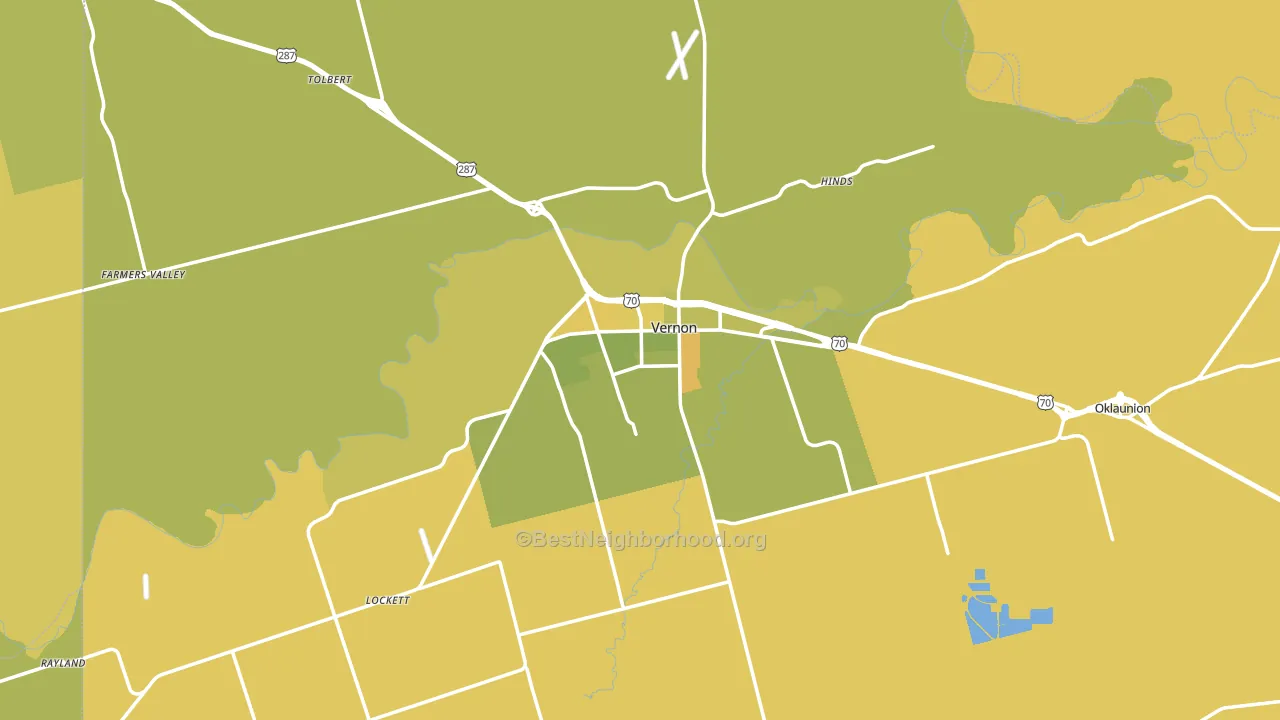
About 58% of adults in Wilbarger County typically vote, near the U.S. average of about 62%. Among adults in Wilbarger County, ~16% vote Democratic, ~42% Republican, and ~42% don't vote. The map below shows estimated turnout by block group.
How Wilbarger County compares
Among counties within 50 miles, Wilbarger County leans more Republican than 1 of 7 neighbors.
Wilbarger County runs about 31 points more Republican than Texas as a whole.
Politics vary noticeably by city within Wilbarger County. The northeast side is the most Republican-leaning (R+68) and the north side is the least Republican-leaning (R+15), a spread of about 53 points.
Why Wilbarger County leans the way it does
This analysis examined 14,881 data points per county to find what predicts political lean and turnout. The items below are a few correlations that stood out for Wilbarger County, not a ranked or complete list of what matters most.
Car-dependent areas vote Republican. About 82% of residents in Wilbarger County drive to work alone, about 9 points above the U.S. average of 74%. Low college attainment predicts Republican voting, and Wilbarger County sits in the bottom quarter (about 17%, below 75% of counties).
Preventive-care access and voter turnout
Places with limited routine preventive-care access tend to turn out at a lower rate; Wilbarger County, TX sits in the bottom tenth nationally on this measure. Dental visits do not drive turnout; the rate reflects income, insurance, and healthcare access, which line up with who votes.
Why turnout in Wilbarger County looks the way it does
Areas with limited routine healthcare access turn out at lower rates. Wilbarger County is in the bottom quarter nationally for routine-care measures such as insurance coverage, preventive screenings, and dental visits. The dental-visit rate here is about 44%, about 9 points below the Texas average of 54%. Renters vote less often than owners, and about 32% of households in Wilbarger County rent, above 81% of counties. Learn more about the findings and methodology on the political spectrum map.
Nearby Counties
- Tillman County, OK R+55
- Hardeman County, TX R+60
- Foard County, TX R+69
- Jackson County, OK R+48
- Baylor County, TX R+66
- Wichita County, TX R+31
- Archer County, TX R+76
- Harmon County, OK R+53
- Knox County, TX R+66
- Greer County, OK R+67
Counties with Similar Populations
- Lincoln County, AR R+41
- Wright County, IA R+36
- Jackson County, KY R+73
- Vinton County, OH R+58
- Millard County, UT R+69
- Bienville Parish, LA R+16
- Presque Isle County, MI R+36
- Crawford County, MI R+31
- Howard County, AR R+33
- Perquimans County, NC R+34
Sources and methodology
Precinct-level voting records used to fit the model come from Texas Secretary of State, Elections Division, distributed by the Voting and Election Science Team. Demographic inputs come from the U.S. Census Bureau (ACS 5-year estimates and the 2020 Decennial Census). Health and environmental inputs come from the CDC (PLACES and the Environmental Justice Index). Land cover comes from the USGS and EPA. Election-day and lead-up weather come from PRISM 4km daily grids and the NOAA Global Historical Climatology Network. Mail-voting and election-administration patterns come from the MIT Election Lab's Survey of the Performance of American Elections. Block-group crime detail comes from CrimeGrade. Internet data and modeling support provided by ISPreports.org.
Modeling and analysis by the BestNeighborhood data science team. Full methodology and findings: political spectrum map.
Methodology reviewed by the BestNeighborhood data team. Last updated May 2026.