Kelsey City, Lake Park, FL Housing Data

This page shows a collection of maps for visualizing Kelsey City, Lake Park, FL housing data.

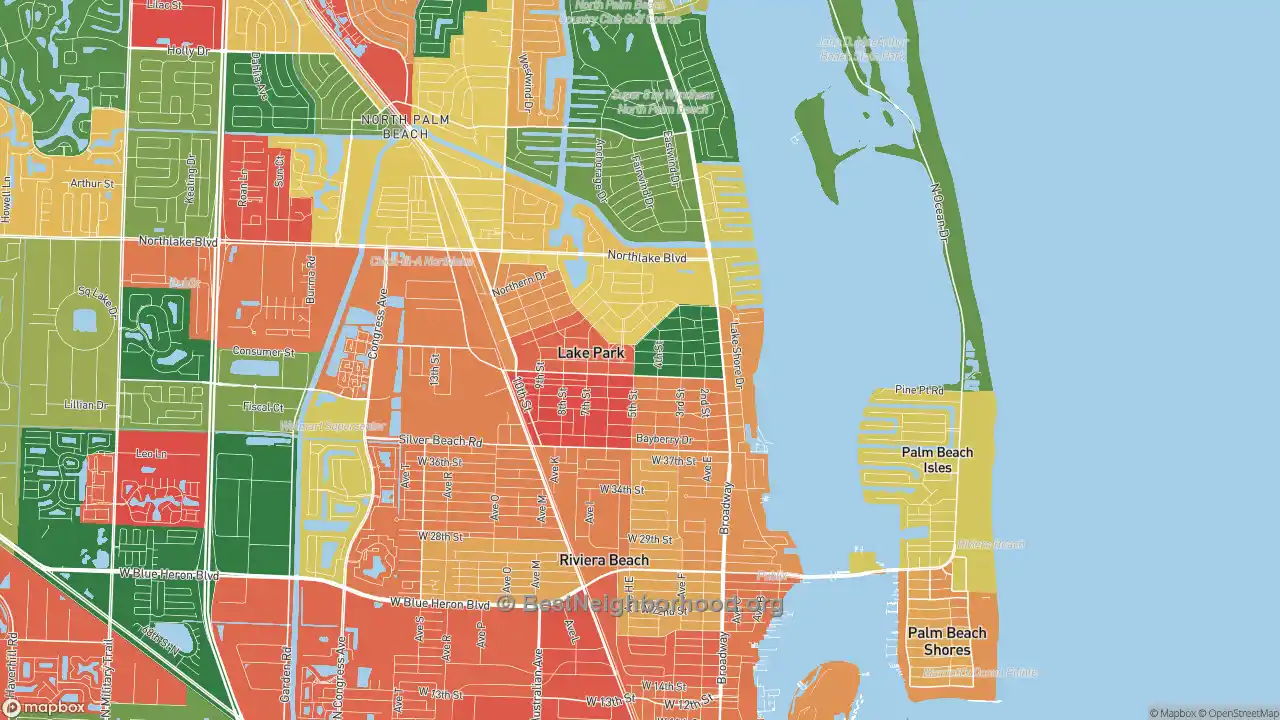
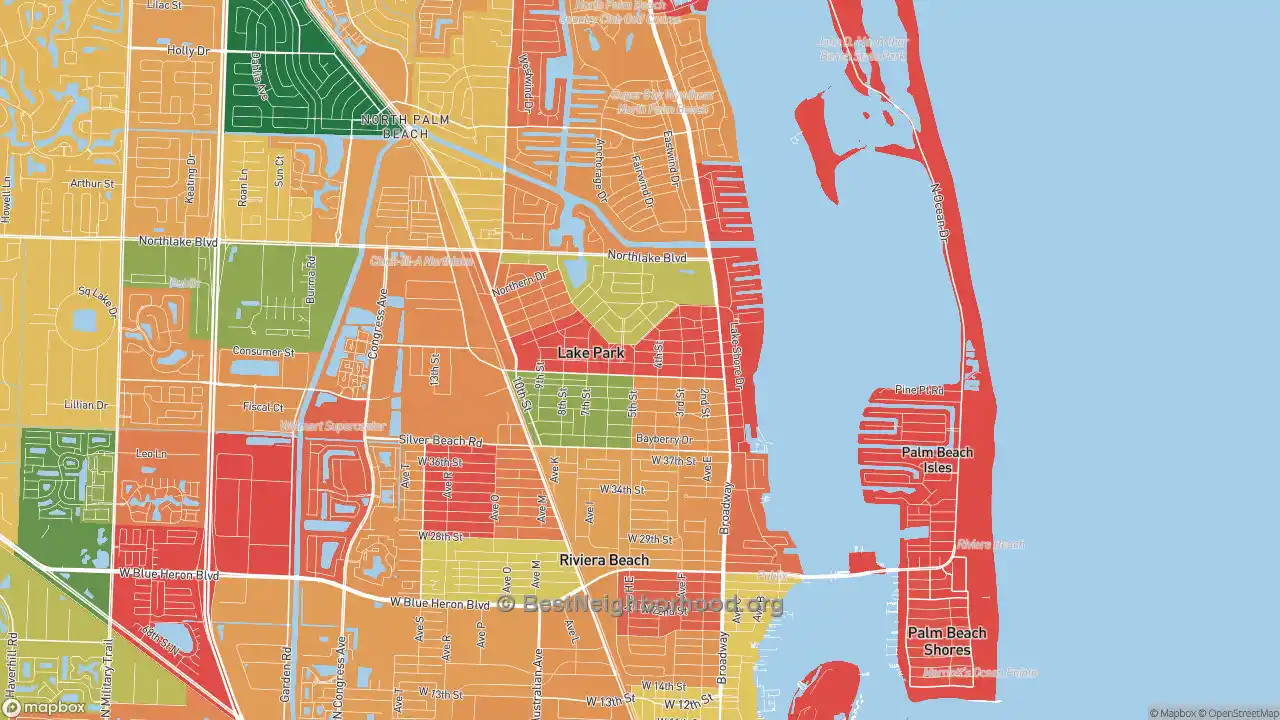
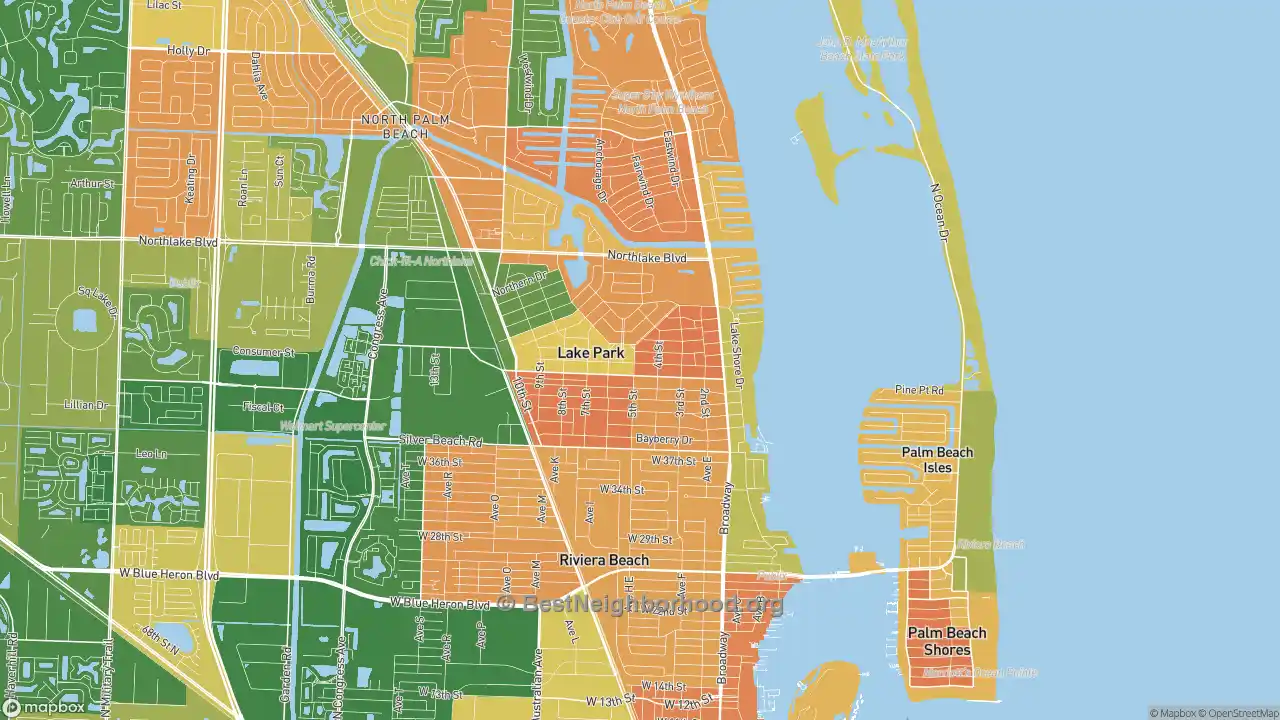
Kelsey City, Lake Park, FL Home Owners and Renters Map

In Kelsey City, 59.04% of people rent their homes or live in apartments. Additionally, 35.18% own their homes free and clear. This map shows which areas are primarily occupied by owners and renters in Kelsey City. See the key below. Areas in grey have 0% owner occupation, which sometimes means there are no homes in the area.


Kelsey City, Lake Park, FL Map of Owner vs. Renter Occupied Neighborhoods
Click the map to explore


Mostly owner-occupied
Mostly renter-occupied

Colorblind friendly
off


Kelsey City, Lake Park, FL Home Vacancy Rates Map

The average vacancy rate in Kelsey City is 23.14%. This map shows vacancy rates by block in the neighborhood. Most home buyers want to avoid vacancies. Not only are vacant properties targets for squatters, but it tends to diminish home values over time. Kelsey City areas with high vacancy rates are shown in red, low vacancy rates in green, and high but manageable vacancies in yellow.


Kelsey City, Lake Park, FL Map of Vacant Houses and Vacancy Rates
Click the map to explore


Low vacancy
High vacancy

Colorblind friendly
off


Kelsey City, Lake Park, FL House Age Map

The average home in Kelsey City was built in 1970. This map shows the average home age by block or county. People looking for newer or older neighborhoods can use the map to see the average age of homes in neighborhoods in Kelsey City. Areas in green have homes that are, on average, 15 years old or newer. Areas in the darkest red shades have homes that are, on average, 80 years old or older.


Kelsey City, Lake Park, FL Map of Old and New Home Neighborhoods by Year Built
Click the map to explore


Newer homes
Older homes

Colorblind friendly
off