The map below shows majority race by area in Queensboro-Brentwood-Crystal Spgs, as self-identified on the US census. Darker shades indicate a larger racial majority in that neighborhood. This page also contains data and maps on Queensboro-Brentwood-Crystal Spgs racial diversity and diversity scores. Click here to scroll to diversity data.
WhiteHispanicBlackAsianMultiple/Other
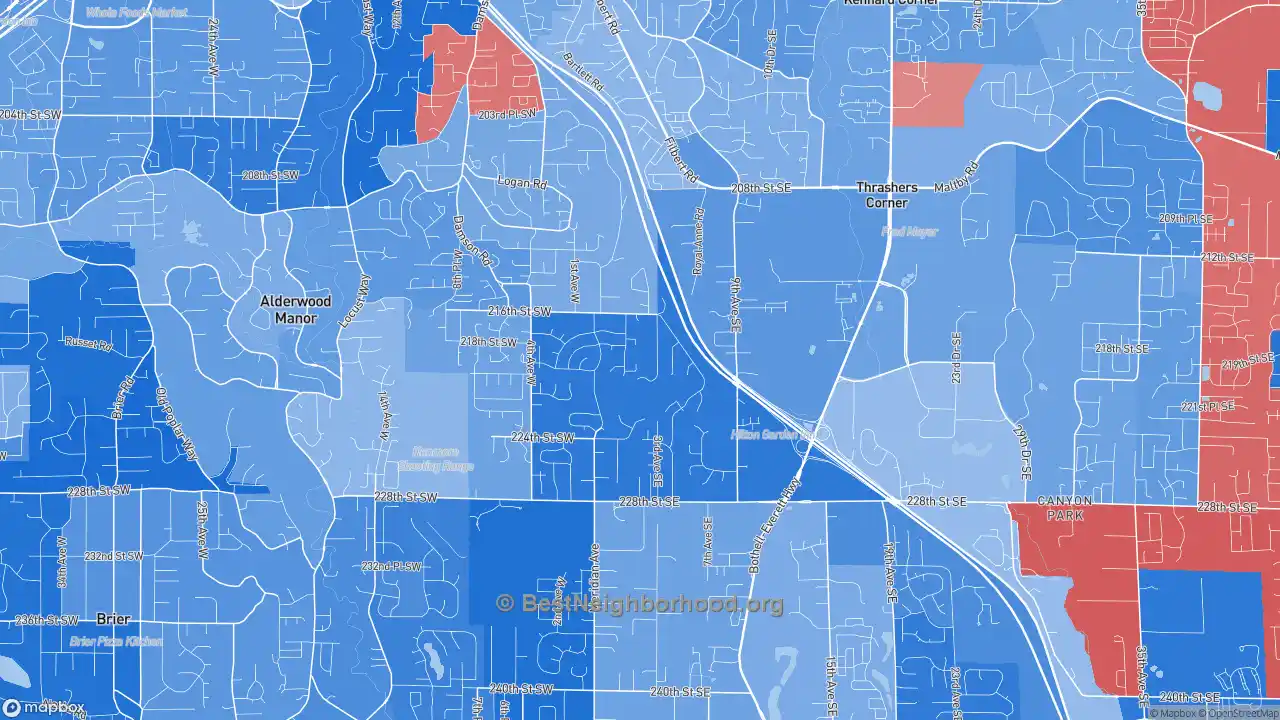
Majority race by area
The majority race in Queensboro-Brentwood-Crystal Spgs overall is white, making up 77.4% of residents. The next most-common racial group is asian at 14.7%. There are more white people in the central areas of the neighborhood. People who identify as asian are most likely to be living in the north places. The data below shows how many people identify themselves as each of the following races, which most Americans base on their family's national origin:
Race in Queensboro-Brentwood-Crystal Spgs
Self-Identified Race |
Queensboro-Brentwood-Crystal Spgs, Bothell, WA Population |
|---|---|
White |
77.4% |
Hispanic |
3.8% |
Black |
0.2% |
Asian |
14.7% |
Native American |
0.9% |
Other |
3.1% |
Diversity and Diversity Scores for Queensboro-Brentwood-Crystal Spgs, Bothell, WA
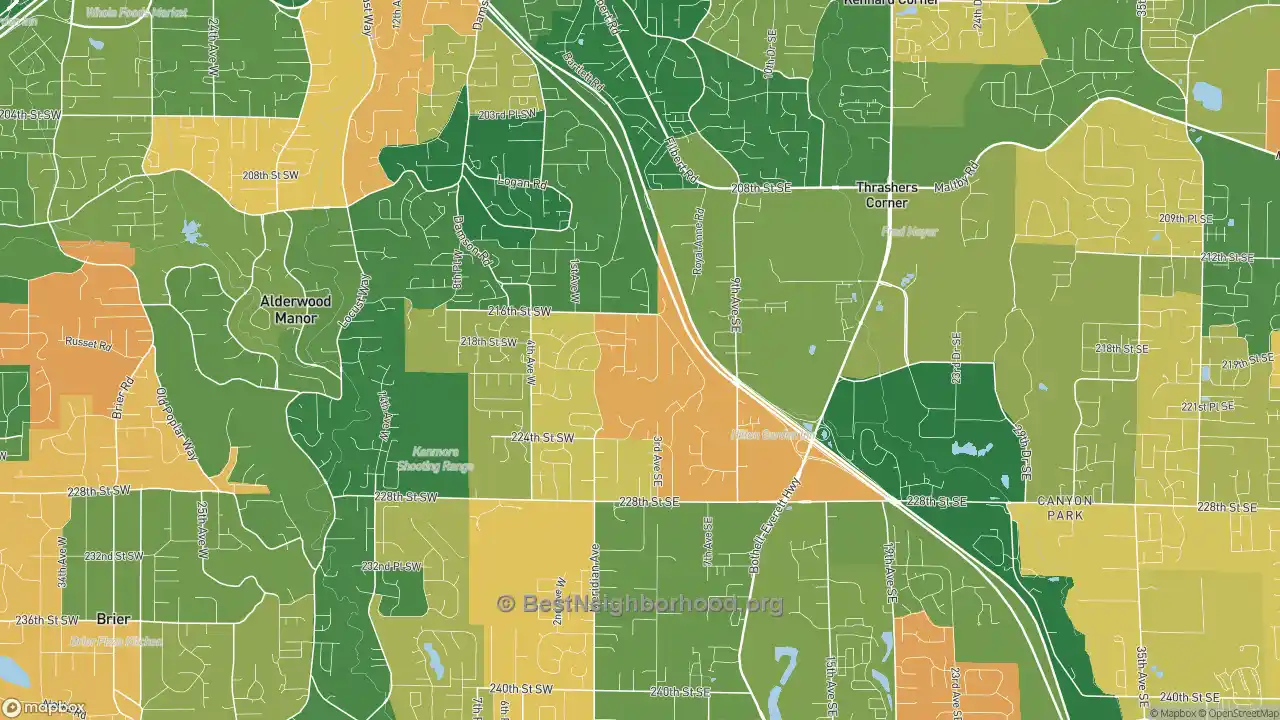
The map below shows diversity in Queensboro-Brentwood-Crystal Spgs. Areas in green are more diverse, while areas in red are much less diverse. Diversity, in this case, means a mixture of people with different race and ethnicity living close to one another. For example, all-black and all-white areas in the neighborhood would both be considered lacking diversity.
More diverse
Less diverse
Colorblind friendly
off
Queensboro-Brentwood-Crystal Spgs Diversity Score
23
With a diversity score of 23 out of 100, Queensboro-Brentwood-Crystal Spgs is less diverse than other US neighborhoods. The most diverse area within Queensboro-Brentwood-Crystal Spgs's proper boundaries is to the north of the neighborhood. The least diverse areas are located in the central parts of Queensboro-Brentwood-Crystal Spgs.
Data Sources: U.S. Census, proprietary data mapping and analysis. Special thanks to the University of Virginia.
Nearby Neighborhoods
- Canyon Park, Bothell, WA: more diverse
- Filbert-Winesap, Bothell West, WA: more diverse
- Thrasher's Corner-Red Hawk, Bothell, WA: more diverse
- Alderwood Manor, Lynnwood, WA: more diverse
- Canyon Creek-39th SE, Bothell, WA: more diverse
- North Creek, Bothell, WA: more diverse
- Westhill, Bothell, WA: more diverse
- Town Center, Woodinville, WA: more diverse
- Downtown Riverfront-190th, Bothell, WA: more diverse
- Downtown Lynnwood, Lynnwood, WA: more diverse
Neighborhoods with Similar Populations
- South End, Albany, NY: more diverse
- Lincoln Park-Buffalo, Tonawanda, NY: less diverse
- North Pointe, St. Louis, MO: less diverse
- Northwood, Tamarac, FL: more diverse
- Park Farms, Kansas City, MO: more diverse
- Putnam Heights, Eau Claire, WI: less diverse
- San Tan Ranch, Gilbert, AZ: more diverse
- Sea View Estates, Oxnard, CA: more diverse
- South 39th Street, Missoula, MT: less diverse
- Morgan Village, Camden, NJ: more diverse