The map below shows majority race by area in Filbert-Winesap, as self-identified on the US census. Darker shades indicate a larger racial majority in that neighborhood. This page also contains data and maps on Filbert-Winesap racial diversity and diversity scores. Click here to scroll to diversity data.
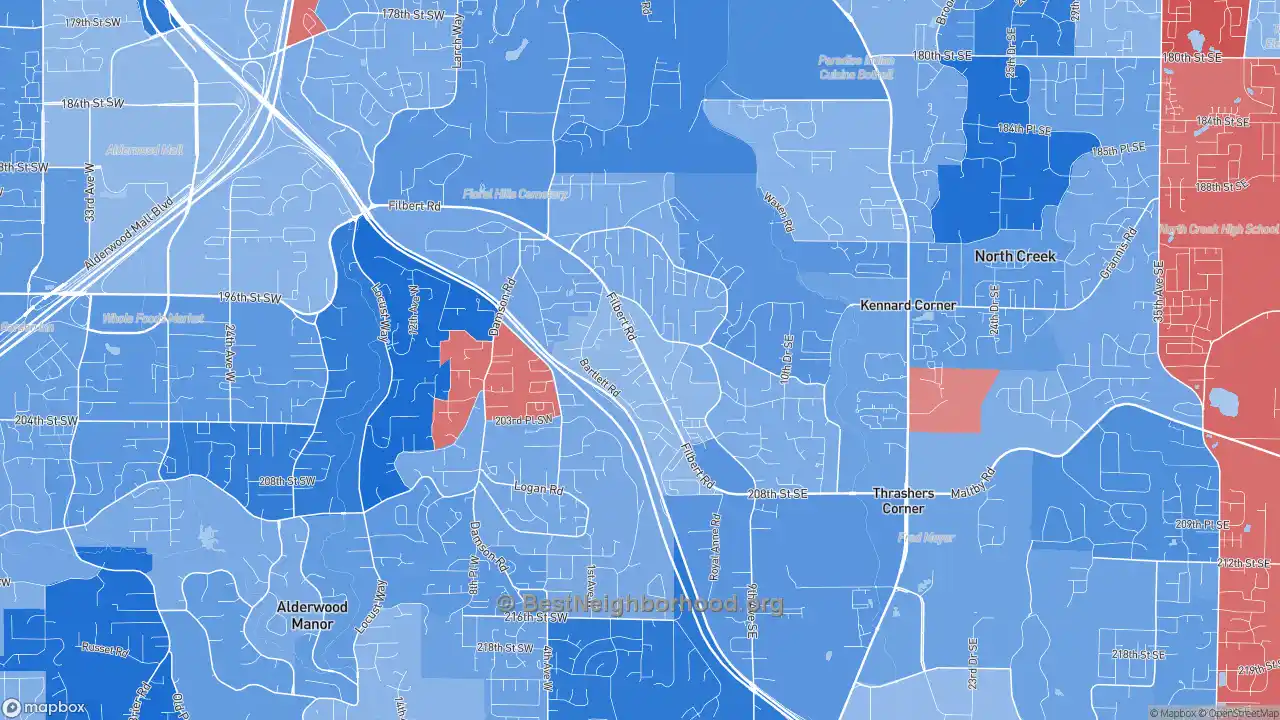
WhiteHispanicBlackAsianMultiple/Other
Majority race by area
The majority race in Filbert-Winesap overall is white, making up 54.6% of residents. The next most-common racial group is asian at 20.6%. There are more white people in the west areas of the neighborhood. People who identify as asian are most likely to be living in the southwest places. The data below shows how many people identify themselves as each of the following races, which most Americans base on their family's national origin:
Race in Filbert-Winesap
Self-Identified Race |
Filbert-Winesap, Bothell West, WA Population |
|---|---|
White |
54.6% |
Hispanic |
17.3% |
Black |
1.2% |
Asian |
20.6% |
Native American |
0.3% |
Other |
5.9% |
Diversity and Diversity Scores for Filbert-Winesap, Bothell West, WA
The map below shows diversity in Filbert-Winesap. Areas in green are more diverse, while areas in red are much less diverse. Diversity, in this case, means a mixture of people with different race and ethnicity living close to one another. For example, all-black and all-white areas in the neighborhood would both be considered lacking diversity.
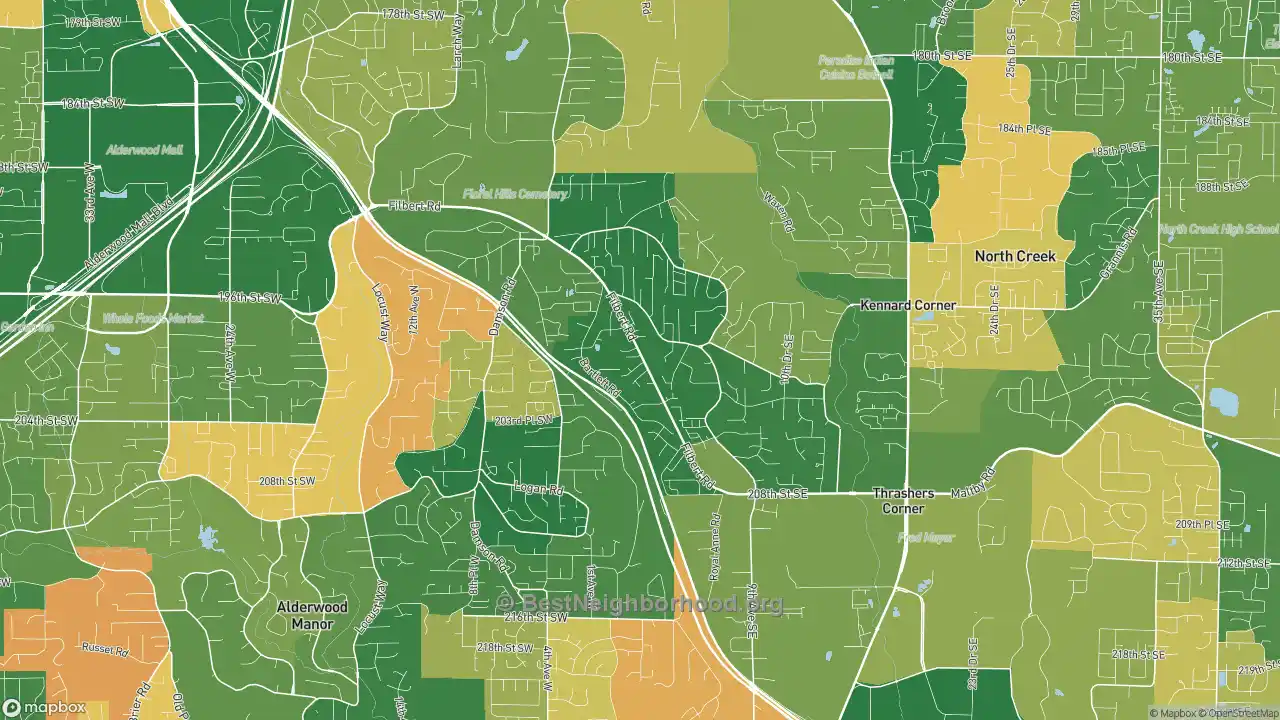
More diverse
Less diverse
Colorblind friendly
off
Filbert-Winesap Diversity Score
85
With a diversity score of 85 out of 100, Filbert-Winesap is much more diverse than other US neighborhoods. The most diverse area within Filbert-Winesap's proper boundaries is to the south of the neighborhood. The least diverse areas are located in the west parts of Filbert-Winesap.
Data Sources: U.S. Census, proprietary data mapping and analysis. Special thanks to the University of Virginia.
Nearby Neighborhoods
- Queensboro-Brentwood-Crystal Spgs, Bothell, WA: less diverse
- Thrasher's Corner-Red Hawk, Bothell, WA: less diverse
- Alderwood Manor, Lynnwood, WA: less diverse
- North Creek, Bothell, WA: less diverse
- Canyon Park, Bothell, WA: more diverse
- Martha Lake, Lynnwood, WA: less diverse
- Canyon Creek-39th SE, Bothell, WA: less diverse
- Downtown Lynnwood, Lynnwood, WA: more diverse
- Pinehurst, Everett, WA: less diverse
- Westhill, Bothell, WA: less diverse
Neighborhoods with Similar Populations
- Hillcrest, Spring Valley, NY: less diverse
- Southside, Louisville, KY: more diverse
- Southeast Springfield, Springfield, MO: less diverse
- South Addition, Anchorage, AK: less diverse
- Sonoma Ranch, Helotes, TX: less diverse
- Snohomish Cascade, Silver Firs, WA: less diverse
- Mid-Hillside, Anchorage, AK: less diverse
- Lucas, Iowa City, IA: less diverse
- Hot Wells, San Antonio, TX: less diverse
- Steep Brook, Fall River, MA: less diverse