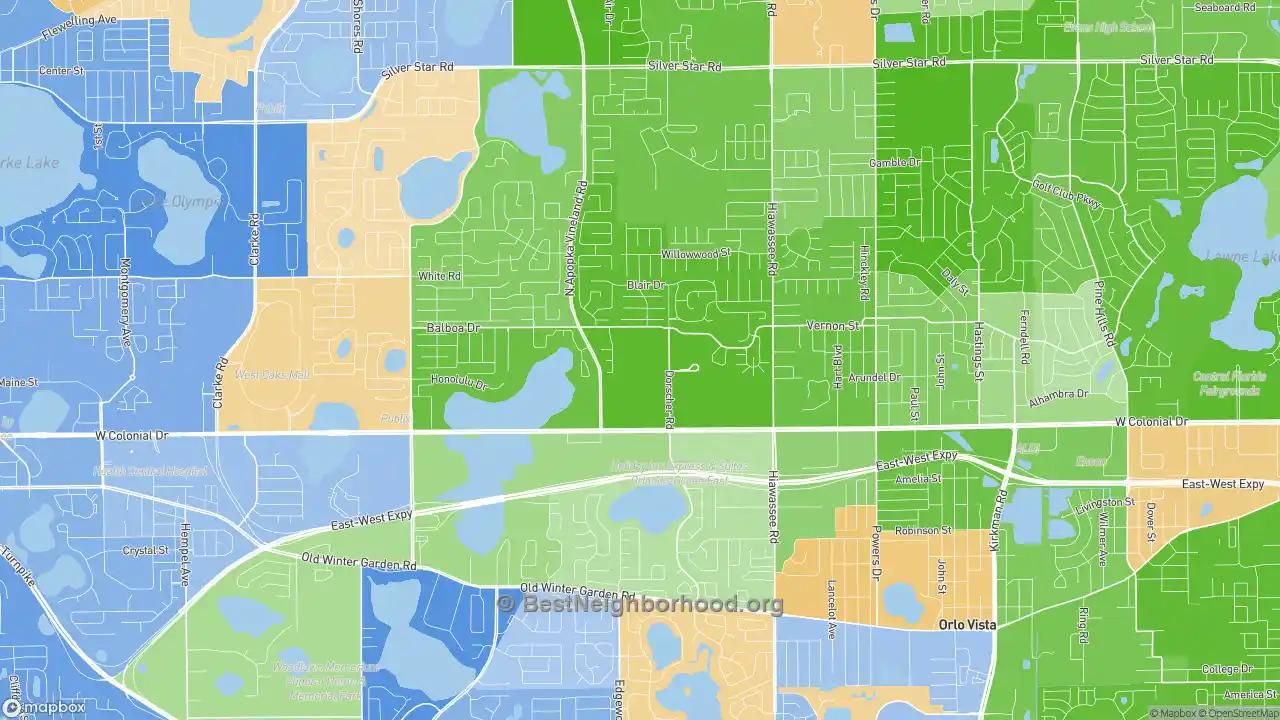
The map below shows majority race by area in Westland Terrace, as self-identified on the US census. Darker shades indicate a larger racial majority in that neighborhood. This page also contains data and maps on Westland Terrace racial diversity and diversity scores. Click here to scroll to diversity data.
WhiteHispanicBlackAsianMultiple/Other
Majority race by area
The majority race in Westland Terrace overall is black, making up 80.3% of residents. The next most-common racial group is hispanic at 14.3%. There are more black people in the central areas of the neighborhood. People who identify as hispanic are most likely to be living in the central places. The data below shows how many people identify themselves as each of the following races, which most Americans base on their family's national origin:
Race in Westland Terrace
Self-Identified Race |
Westland Terrace, Pine Hills, FL Population |
|---|---|
White |
3.8% |
Hispanic |
14.3% |
Black |
80.3% |
Asian |
0.3% |
Native American |
0.0% |
Other |
1.4% |
Diversity and Diversity Scores for Westland Terrace, Pine Hills, FL
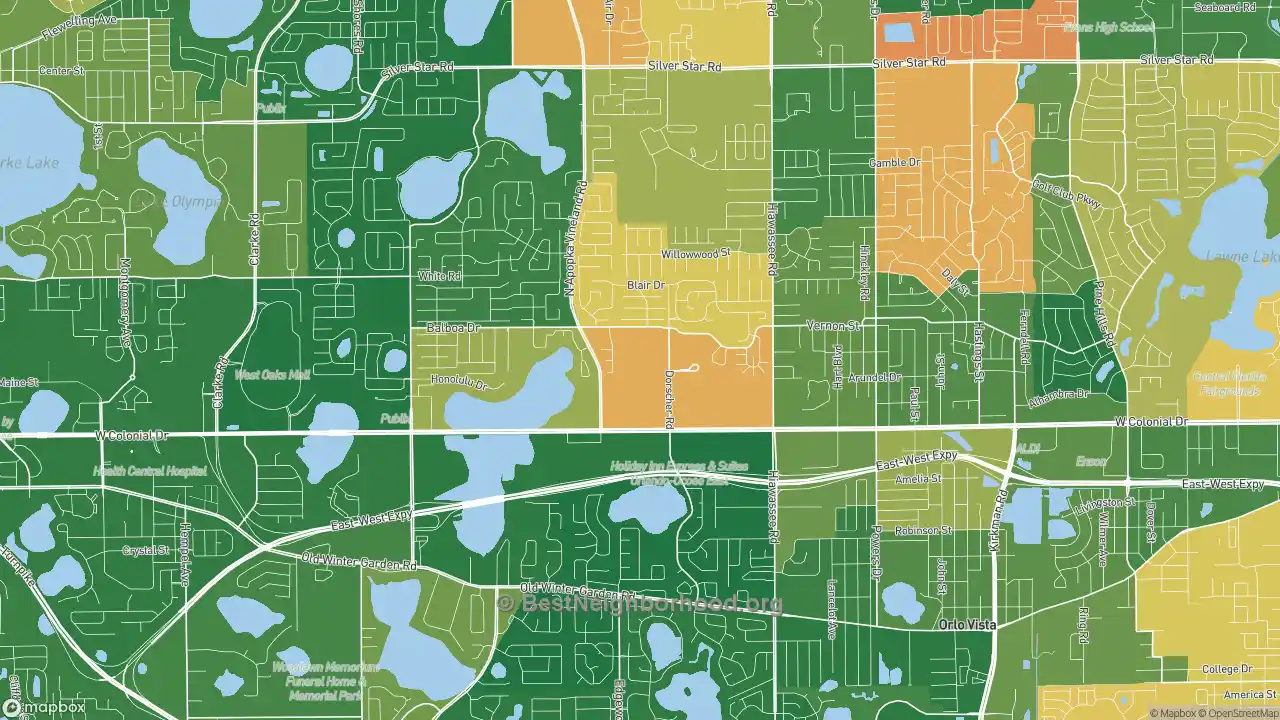
The map below shows diversity in Westland Terrace. Areas in green are more diverse, while areas in red are much less diverse. Diversity, in this case, means a mixture of people with different race and ethnicity living close to one another. For example, all-black and all-white areas in the neighborhood would both be considered lacking diversity.
More diverse
Less diverse
Colorblind friendly
off
Westland Terrace Diversity Score
16
With a diversity score of 16 out of 100, Westland Terrace is much less diverse than other US neighborhoods. The most diverse area within Westland Terrace's proper boundaries is to the southwest of the neighborhood. The least diverse areas are located in the central parts of Westland Terrace.
Data Sources: U.S. Census, proprietary data mapping and analysis. Special thanks to the University of Virginia.
Nearby Neighborhoods
- Forest Park, Pine Hills, FL: more diverse
- Metro West, Orlando, FL: more diverse
- Kirkman North, Orlando, FL: more diverse
- Mercy Drive, Orlando, FL: more diverse
- Rosemont North, Orlando, FL: more diverse
- Camellia Gardens, Orlando, FL: more diverse
- Richmond Heights-Orlando, Orlando, FL: less diverse
- Rosemont, Orlando, FL: more diverse
- Kirkman South, Orlando, FL: more diverse
- Florida Center North, Orlando, FL: more diverse
Neighborhoods with Similar Populations
- 3rd Ward, Portsmouth, OH: less diverse
- Emerald Lake-Miami, Lake Worth, FL: more diverse
- Elton Hills, Rochester, MN: less diverse
- Edgewood, Michigan City, IN: more diverse
- Downtown East, Minneapolis, MN: more diverse
- Downtown Conneaut, Conneaut, OH: less diverse
- Coquina Key, St. Petersburg, FL: more diverse
- Columbia San Diego, San Diego, CA: more diverse
- Caprock, Lubbock, TX: more diverse
- Westbury, Lehi, UT: less diverse