
Enter your city or zip code below to see Community Health data for any place in the US.
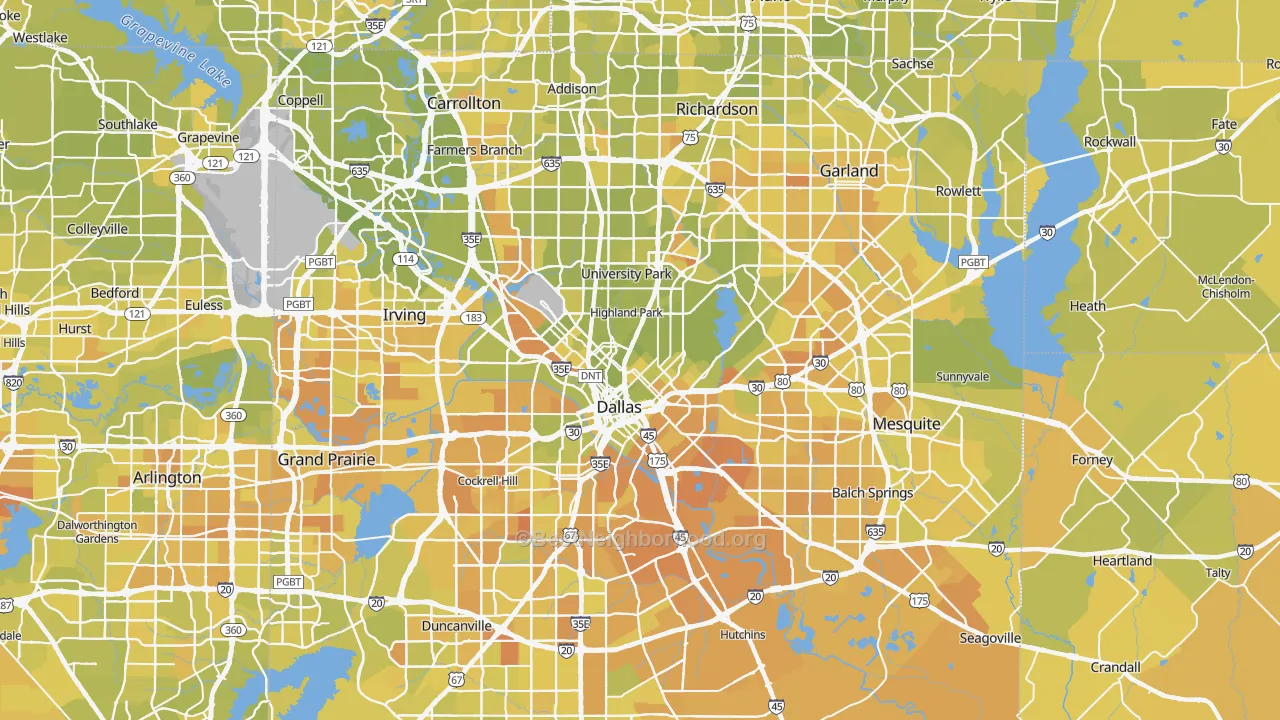
An example Community Health Need Index map of Dallas, TX. Tracts in green have less measured health need; tracts in red have more.
How community health varies across the United States
The state of health varies widely across the country, and often in surprising ways. A community where almost no one smokes can still be the place where people struggle most to reach a doctor. A town full of chronic illness can have some of the easiest access to care in the nation. The differences between places are large, and they rarely line up the way you would expect.
To compare one community to the next, BestNeighborhood reads the health data the U.S. Centers for Disease Control and Prevention PLACES program reports for every place in the country, then sums it into one figure called the Community Health Need Index. It runs from 0 to 100, where 50 is the national average and a higher number means more measured health need. Read across all 83,522 U.S. neighborhoods, it turns up a few patterns worth a closer look.
- Where health need is highest and lowest
- Why reaching care is its own kind of need
- What the Community Health Need Index measures
- How the index is calculated
Health need is highest in the Ohio Valley and Deep South, lowest in the Northeast and Mountain West
Health need is not spread evenly. West Virginia carries the most of any state, scoring near 64. Louisiana, Mississippi, Kentucky, Arkansas, and Oklahoma follow close behind. The lowest-need states sit on the coasts and in the Mountain West: the District of Columbia is lowest, near 37, followed by Utah, New Jersey, New Hampshire, Hawaii, and Connecticut, all close to 40. The distance between the top and bottom is about 26 points, more than a quarter of the whole scale.
The healthiest and hardest-hit large cities
The contrast is sharper between individual cities. Among the 1,188 cities with at least 50,000 residents, the index runs from about 25 in Cupertino, California to about 72 in Gary, Indiana. The healthiest large cities are mostly high-income tech and university suburbs. The hardest-hit cluster in the industrial Midwest and along the Gulf Coast.
Community Health Need Index for the eight lowest-need and eight highest-need cities with 50,000 or more residents. Source: BestNeighborhood Community Health Need Index, CDC PLACES 2025 release.
Reaching care is its own kind of need
Health need is not one thing. The index is built from three parts: how much disease a community already carries, how much risk it is building through everyday habits, and how easily residents can reach care. The first two tend to rise and fall together. Whether people can get to a doctor is a separate story. Across large cities, disease and risk move almost in lockstep, while the ability to reach care barely tracks either one.
Provo, Utah shows why that matters. Its residents have some of the lowest-risk habits in the country, with very little smoking or heavy drinking, yet they face higher-than-average trouble reaching care. The Villages, Florida is the mirror image: an older population carrying real disease, but among the easiest access to care anywhere. This is why each place page reports the three parts right next to the overall index. The overall number tells you how much total need a community carries. The three parts tell you what kind, so a reader can see whether the story is disease, daily habits, or simply getting to a doctor.
The barriers fall hardest on communities with the least
To see who struggles most to reach care, BestNeighborhood matched the access part of the index to Census income data for 82,037 neighborhoods. The pattern is stark. In the lowest-income fifth of the country, the access reading averages 65. In the highest-income fifth, it averages 37. At the very ends the gap is wider still: the poorest tenth of neighborhoods averages 70, the richest tenth just 35.
The same split shows up by race. In neighborhoods where people of color are most of the population, the access reading averages 67, against 38 where they are a small share. These gaps echo decades of documented differences in who can reach care in the United States, reported by the Agency for Healthcare Research and Quality.
Access-and-barriers sub-index by census-tract median household income, population-weighted, lowest-income fifth to highest. Source: BestNeighborhood Community Health Need Index joined to U.S. Census American Community Survey 2023 5-year estimates.
Health access tracks civic participation
The access measures that drive this sub-index also turn up in BestNeighborhood’s political modeling. A cluster of health-access measures, led by the share of adults without health insurance, together explains roughly 20% of the variation in voter turnout across U.S. precincts. In the best-insured quartile of precincts, turnout averages 74% of voting-age adults. In the worst-insured quartile it averages 46%, a 28-point gap that holds after controlling for race, income, education, and age. Whether a community can reach care is bound up with whether it shows up to vote. The full analysis is on the BestNeighborhood political spectrum map.
What the Community Health Need Index measures
The Community Health Need Index (CHNI) is one number, published for every U.S. place, that sums up how much measured health need a community has compared to the rest of the country. It draws on 39 of the health measures the CDC reports for each place and sorts them into three parts:
- Current health burden: how much diagnosed disease, mental-health strain, and disability adults in the place report today.
- Preventable risk: how much future disease residents are building now through smoking, blood pressure, weight, alcohol, inactivity, short sleep, and cholesterol.
- Access and barriers: how easily residents can reach the care, food, housing, and support that would help them.
By design, 50 is the national average, so most communities land near the middle, with smaller numbers of very-low-need and very-high-need places trailing off at each end. A reading above 50 means more measured need than the country as a whole. The index is a measure of need, not a grade or a verdict on whether a place is good to live in. It does not predict any one person’s health, and nothing here is medical advice.
Where U.S. neighborhoods fall on the index, from least need (left) to most (right). Source: BestNeighborhood Community Health Need Index, built on CDC PLACES 2025 release tract data.
How the Community Health Need Index is calculated
This section documents what goes into the number, where every weight comes from, and where the methodology has known limits. Every weight resolves to a federal dataset or a peer-reviewed source listed in the references.
What the index measures, and what it does not
The CHNI rolls up 39 community-level measures from CDC PLACES into three sub-indices, then into one overall value per place. Current Health Burden captures how much diagnosed disease and disability adults report today. Preventable Risk captures how much future disease residents are building through smoking, blood pressure, weight, alcohol, inactivity, sleep, and cholesterol. Access and Barriers captures whether residents can reach the care, food, housing, and support that would help them.
The CHNI is a needs assessment. A higher value means more measured health need than the U.S. average, not a verdict on quality of life or desirability. It does not replace clinical judgment, does not predict any individual’s health, and offers no medical recommendation. Definitions and prevalence estimates for every measure come from CDC PLACES tract-level data, which is itself produced by small-area estimation from the Behavioral Risk Factor Surveillance System and the U.S. Census American Community Survey [1].
Why “index” and not “score”
The word matters. Federal agencies that publish similar composites use “index” deliberately: the CDC Social Vulnerability Index, the HRSA Area Deprivation Index, and the WHO Healthy Life Expectancy estimates all use the term to signal a transparent composite derived from named public data with documented weights. The word “score” or “grade” implies editorial judgment about a place. The CHNI does not render that judgment, and the naming follows the agency convention to make that clear.
The double-counting problem, and the three-tier solution
A naive approach would weight all 39 measures in one flat list and add them up. That approach fails on this dataset because the measures overlap by design. Smoking is upstream of coronary heart disease, COPD, and lung cancer. High blood pressure is upstream of stroke and most heart disease. Obesity is upstream of diabetes, certain cancers, and joint disease. Counting smoking and COPD with equal weight in the same list double-counts the same biological pathway.
The standard answer in the health-economics literature is to anchor the weights to Disability-Adjusted Life Years (DALYs), which are the metric the WHO and the IHME Global Burden of Disease study use to compare disease impacts on common ground. A DALY is one year of healthy life lost, computed as the sum of Years of Life Lost to premature death and Years Lived with Disability [4][5]. Smoking and COPD do not get double-counted in GBD because GBD distinguishes between causes of disease (where COPD’s DALYs are counted) and risk factors for disease (where smoking’s attributable DALYs are counted, separately). The two views are kept on different ledgers.
The CHNI applies the same separation. The 39 PLACES measures split cleanly into three groups that map to three internally consistent ledgers:
- Current burden is weighted by cause-level DALYs. Each chronic condition’s weight is its share of total U.S. DALYs across the conditions measured.
- Preventable risk is weighted by risk-attributable DALYs. Each risk factor’s weight is its share of total U.S. risk-attributable DALYs across the seven risk factors measured.
- Access and barriers is weighted by published mortality and morbidity effect sizes. DALYs are not the right anchor here because access barriers are pathways, not diseases.
The three sub-indices roll up into one CHNI value with explicit, adjustable sub-index weights documented in Combining the sub-indices below. Because each measure lives in only one ledger, no biological pathway is counted twice.
Sub-index 1: Current Health Burden
This sub-index captures how much diagnosed disease, mental-health symptom load, and functional disability exists in a place today. Eighteen PLACES measures are included: diabetes, coronary heart disease, stroke, cancer (excluding skin), COPD, current asthma, arthritis, depression, fair or poor general health, frequent physical distress, frequent mental distress, all teeth lost (adults 65+), mobility limitation, cognitive limitation, hearing limitation, vision limitation, self-care limitation, and independent-living limitation.
Weighting method. Each measure is weighted by its corresponding share of U.S. DALYs in the IHME Global Burden of Disease 2021 study [5]. The U.S. country-level estimates come from the GBD 2021 U.S. Burden of Disease Collaborators paper published in The Lancet in December 2024 [6]. That paper identifies the leading causes of disability in the United States: low back pain remained the leading cause of years lived with disability in 1990 and 2021, with depressive disorders and drug use disorders the second- and third-leading causes by 2021 [6]. Hawaii recorded the lowest age-standardized rate of years lived with disability across all sexes (12,085.3 per 100,000) and West Virginia the highest (14,832.9 per 100,000) [6].
Three measures do not map directly to a GBD condition and are handled as documented proxies:
- Fair or poor general health (GHLTH) is a self-rated composite, not a condition. A meta-analysis of 22 studies covering nearly 700,000 adults found that respondents reporting fair or poor self-rated health had a hazard ratio of roughly 1.9 for all-cause mortality compared with those reporting good health [7]. GHLTH is weighted as a composite signal calibrated against the weighted DALY total of the conditions it summarizes.
- Frequent physical distress (PHLTH) is approximated by the GBD musculoskeletal and chronic-pain envelopes, anchored to low back pain (the leading U.S. cause of years lived with disability) [6].
- Frequent mental distress (MHLTH) is approximated by the GBD years-lived-with-disability estimate for depressive disorders, which rose 56.0% in age-standardized rate between 1990 and 2021 in the United States [6].
Disability subtypes (mobility, cognition, hearing, vision, self-care, independent living) are weighted using the GBD impairment-envelope DALY estimates for musculoskeletal disease, Alzheimer’s and other dementias, hearing loss, and vision loss, drawn from the same GBD 2021 release [5][8]. Self-care and independent-living limitations do not have direct GBD equivalents; they are approximated by the mean of the mobility and cognition weights, with the proxy flagged in the weight rationale.
Disability weights. The severity assigned to each non-fatal health state inside the DALY calculation comes from the Salomon et al. 2015 Global Health Estimates disability-weights study, the canonical source used by GBD [9]. Those weights are derived from population surveys in five countries and a web-based survey of more than 30,000 respondents, calibrated against a paired-comparison method. They represent population-averaged severity, not individual judgment.
Normalization. For each measure i in the Current Burden sub-index, the weight is computed as weight_i = condition_dalys_i / sum_over_18_measures(condition_dalys). Weights sum to 1 within the sub-index.
Sub-index 2: Preventable Risk
This sub-index captures how much future disease residents are building today. Seven PLACES measures are included: adult smoking, binge drinking, no leisure-time physical activity, short sleep duration, obesity, high blood pressure, and high cholesterol.
Weighting method. Each measure is weighted by its share of U.S. risk-attributable DALYs in GBD 2021 [10]. GBD reports risk-attributable DALYs at country level for 88 risk factors using the comparative risk assessment framework, which estimates how much disease burden would be averted under counterfactual exposure distributions [10]. The GBD 2021 U.S. paper identifies the three highest-ranked Level-2 risk factors for U.S. deaths in 2021 as high systolic blood pressure, high fasting plasma glucose, and tobacco use [6]. Between 1990 and 2021, mortality attributable to high systolic blood pressure fell 47.8% in age-standardized terms, tobacco-attributable mortality fell 5.1%, and high-fasting-plasma-glucose-attributable mortality rose 9.3% [6].
Supporting figures from federal data on the specific risk factors measured:
- Tobacco: cigarette smoking causes more than 480,000 deaths per year in the United States, including roughly 41,000 deaths from secondhand smoke exposure, according to the CDC [11]. A 2024 modeling validation found this estimate remains current [12].
- Alcohol: deaths from excessive alcohol use averaged 178,307 per year during 2020 to 2021, a 29% increase from 137,927 per year during 2016 to 2017, per CDC MMWR [13].
- Physical inactivity: an estimated 8.3% of U.S. adult deaths are associated with inadequate leisure-time physical activity (less than 150 minutes per week of moderate-intensity activity), per CDC analysis [14].
- Short sleep: GBD 2021 does not include short sleep as a standalone risk factor. The Itani et al. 2017 meta-analysis of 153 studies reports a relative risk of 1.12 (95% CI 1.08 to 1.16) for all-cause mortality among adults sleeping six or fewer hours, with stronger effects at shorter durations [15]. Short sleep is included with a weight calibrated to its hazard ratio at U.S. prevalence rather than to a GBD attributable-DALY count.
Normalization. Weights are computed as weight_i = risk_dalys_i / sum_over_7_measures(risk_dalys), with short sleep entering via a published hazard-ratio proxy described in the source CSV. Weights sum to 1 within the sub-index.
Why this does not double-count Sub-index 1. Smoking’s DALYs in this ledger are independent of COPD’s DALYs in Sub-index 1. The two enter the overall CHNI only through the sub-index weights documented below, where they compete for influence with each other, not with conditions in the other ledger.
Sub-index 3: Access and Barriers
This sub-index captures whether residents can reach the care, food, housing, and support they need. Fourteen PLACES measures are included: annual doctor visit, cholesterol screening, colorectal cancer screening, mammography screening, annual dental visit, blood-pressure medication adherence, uninsurance among adults 18 to 64, loneliness, lack of social-emotional support, food insecurity, SNAP receipt, housing insecurity, utility shut-off threat, and lack of reliable transportation.
Why DALYs are not the right anchor here. Access barriers are not diseases. They are upstream conditions that determine whether a person can get help with the conditions in Sub-index 1 or change the risk factors in Sub-index 2. The GBD framework does not publish DALYs for “being uninsured” or “lacking transportation.” Instead, the weight for each measure in this sub-index is a severity score on a 1-to-10 scale informed by published mortality and morbidity effect sizes. Each rationale is documented in weight_rationale in the source CSV and summarized below.
Per-measure severity rationale
Uninsurance (ACCESS2): The Institute of Medicine’s 2002 Care Without Coverage report estimated that approximately 18,000 U.S. adults aged 25 to 64 died each year from causes related to lack of health insurance [16]. An updated analysis by Wilper et al. using the Third National Health and Nutrition Examination Survey (n=9,005, follow-up to 2000) found a hazard ratio of 1.40 (95% CI 1.06 to 1.84) for all-cause mortality among uninsured adults aged 17 to 64 compared with insured adults, and estimated approximately 44,789 deaths in 2005 associated with lack of insurance [17]. Subsequent quasi-experimental studies of Medicaid expansion have reported significant mortality reductions following coverage gains [18][19]. Uninsurance is weighted at the upper end of the 1-to-10 scale (8 to 9) because it gates access to nearly every other clinical intervention measured.
Food insecurity (FOODINSECU): Ma et al. 2024 followed 57,404 U.S. adults from the National Health and Nutrition Examination Survey 1999 to 2018 with mortality linkage through 2019 and reported hazard ratios for all-cause premature mortality of 1.50 (95% CI 1.31 to 1.71) for marginal food security, 1.44 (1.24 to 1.68) for low food security, and 1.81 (1.56 to 2.10) for very low food security, with adults reporting very low food security living an average of 4.5 fewer years at age 50 than those with full food security [20]. Food insecurity is weighted at the upper end of the 1-to-10 scale (8 to 9).
Housing insecurity (HOUSINSECU): Direct mortality estimates for the broader “housing-insecure” population are less well-developed than estimates for homelessness. Roncarati et al. studied 445 unsheltered homeless adults in Boston over 10 years and reported an age-standardized all-cause mortality rate nearly 10 times that of the Massachusetts adult population [21]. The 2018 National Academies of Sciences review concluded that permanent supportive housing improves housing stability and reduces emergency-department use, with mortality effects less well-documented but plausible given the magnitude of upstream effects [22]. Housing insecurity is weighted at the upper-middle range (7 to 8). The rationale flags that the available evidence base is stronger for homelessness than for the broader housing-insecure population that PLACES measures.
Colorectal cancer screening (COLON_SCREEN): The U.S. Preventive Services Task Force 2021 update recommends screening for adults aged 45 to 75 and cites modeling and trial evidence that screening reduces colorectal-cancer mortality [23]. The NordICC trial, the only large randomized trial of screening colonoscopy, reported an intention-to-treat relative risk of 0.82 (95% CI 0.70 to 0.93) for colorectal cancer incidence and 0.90 (95% CI 0.64 to 1.16) for colorectal cancer mortality after 10 years of follow-up, with 42% of those invited actually undergoing screening [24]. Per-protocol estimates, observational cohorts, and CDC modeling consistently point to a larger mortality reduction (40% to 60%) at full adherence [25]. The measure is weighted at moderate-to-high (6 to 7), with the rationale noting that the NordICC intention-to-treat estimate is consistent with population-level uptake limits, not screening failure.
Mammography screening (MAMMOUSE): The Independent UK Panel on Breast Cancer Screening reviewed 11 randomized trials and reported a relative risk of approximately 0.80 for breast-cancer mortality among women invited to screening, corresponding to roughly a 20% relative reduction [26]. The USPSTF currently recommends biennial screening for women aged 40 to 74 [27]. Because the measure is restricted to women aged 50 to 74 in CDC PLACES, the weight is moderate (5 to 6) at the sub-population level.
Cholesterol screening (CHOLSCREEN) and annual doctor visit (CHECKUP): Neither measure directly causes mortality reduction on its own. The Krogsbøll Cochrane 2019 systematic review of 17 randomized trials covering 233,298 participants found that general health checks had little or no effect on all-cause mortality (risk ratio 1.00, 95% CI 0.97 to 1.03) [28]. These measures are weighted at the moderate range (4 to 6) because they function as gateway access measures: a routine visit is where high blood pressure, high cholesterol, and screening eligibility are usually identified. The weight reflects gateway value, not a claim that the visit itself reduces all-cause mortality.
Blood-pressure medication adherence (BPMED): The SPRINT trial randomized 9,361 adults with elevated blood pressure to intensive (target less than 120 mm Hg) versus standard (target less than 140 mm Hg) systolic control and reported a hazard ratio of 0.73 (95% CI 0.60 to 0.90) for all-cause mortality and a 25% reduction in the primary composite cardiovascular outcome [29]. The American Heart Association 2024 Heart Disease and Stroke Statistics Update documents the cardiovascular burden that blood-pressure control modifies [30]. Adherence is the practical bridge between a diagnosis and that mortality reduction, and the measure is weighted moderate (5).
Annual dental visit (DENTAL): Dental coverage is excluded from most basic U.S. health insurance, which makes annual dental visits a strong proxy for underinsurance. Poor oral health is linked in observational studies to cardiovascular disease and diabetes complications, though causal mortality estimates remain debated [31]. The measure is weighted moderate (4 to 5) as a coverage signal, with the rationale flagging the indirectness of the mortality pathway.
Loneliness (LONELINESS) and lack of social-emotional support (EMOTIONSPT): The Holt-Lunstad et al. 2015 meta-analysis covering 70 studies and more than 3.4 million participants reported weighted average odds ratios of 1.29 for social isolation, 1.26 for loneliness, and 1.32 for living alone in association with all-cause mortality, with effects comparable in magnitude to obesity and physical inactivity [32]. The U.S. Surgeon General’s 2023 advisory Our Epidemic of Loneliness and Isolation concluded that social disconnection carries mortality risk on the order of smoking up to 15 cigarettes a day [33]. Both measures are weighted moderate (5 to 6), with EMOTIONSPT approximated by the same effect-size range pending direct estimates.
SNAP receipt (FOODSTAMP), utility shut-off threat (SHUTUTILITY), and lack of reliable transportation (LACKTRPT): These three measures are precarity markers rather than direct mortality exposures. SNAP receipt rates measure both program reach and underlying economic stress, per the U.S. Department of Agriculture [34]. Utility shut-offs are a proxy for energy poverty; CDC data show roughly 1,300 deaths per year from extreme heat and cold exposure, with broader effects on chronic-disease management [35]. Transportation barriers were the cause cited by 5.8 million U.S. adults (1.8% of the adult population) who delayed medical care in 2017, per analysis of National Health Interview Survey data 1997 to 2017 [36]. Each is weighted in the lower-to-middle range (3 to 5), with rationales documenting the indirect mortality pathway.
Normalization. After severity scores are assigned on the 1-to-10 scale, weights are computed as weight_i = severity_i / sum_over_14_measures(severity). Weights sum to 1 within the sub-index.
Combining the three sub-indices
The overall Community Health Need Index for a place is the weighted sum of the three sub-index values:
CHNI = W1 × current_burden + W2 × preventable_risk + W3 × access_barriers
The starting-point sub-index weights are:
- W1 = 0.45 (Current Health Burden)
- W2 = 0.30 (Preventable Risk)
- W3 = 0.25 (Access and Barriers)
Rationale. Current burden is the largest weight because it represents present, measured need: residents already living with the condition. Preventable risk is the second weight because it represents need that will materialize, but the people in question are not currently suffering at the magnitude implied by their downstream disease. Access and barriers is the smallest weight because it is structural: it shapes how the first two sub-indices can be addressed but does not by itself add to the disease burden the community is carrying today. The 0.45 / 0.30 / 0.25 split places the heaviest weight on what is happening now, while preserving substantial influence for the leading indicators and the structural enablers.
This weighting is a transparent design choice, not a derived constant. Analogous composite indices use different weightings appropriate to their goals: the CDC Social Vulnerability Index uses equal weights across four themes [2]; the County Health Rankings model splits “health outcomes” and “health factors” with explicit sub-weights [37]; the HRSA Area Deprivation Index aggregates 17 census measures into a single index [3]. The CHNI weights are documented to be auditable and revisable; sensitivity analysis at alternative splits (for example, 0.40 / 0.35 / 0.25 or 0.50 / 0.25 / 0.25) is reported alongside the published index.
Per-place computation
For each PLACES measure in a sub-index, BestNeighborhood computes a measure score for each place using the following steps:
- Directional z-score: the place’s measure value is converted to a z-score against the national tract-level distribution. For measures where higher values indicate worse outcomes (for example, diabetes prevalence), the z-score is used directly. For measures where higher values indicate better outcomes (for example, cholesterol screening rate), the sign is flipped so that “more need” is always positive.
- Sigmoid transform: the directional z-score is mapped to a 0-to-100 measure score using
measure_score = 50 + 50 × tanh(z / 2). The hyperbolic-tangent transform caps extreme outliers and yields a value where 50 equals the national average, values above 50 indicate more need, and values below 50 indicate less. - Sub-index value: the sub-index value for a place is the weighted average of measure scores, using the weights documented above.
- CHNI value: the overall CHNI is the weighted average of the three sub-index values, using W1, W2, and W3.
The output is reported alongside the U.S. average reference of 50 and a plain-English interpretation of the place’s position relative to that reference. Underlying measure prevalences, sub-index values, and national percentiles are all displayed on the place page so a reader can audit the rollup.
Known limits and what this index does not claim
CDC PLACES is a model-based small-area estimate, not a direct census. The tract-level prevalences are produced by multilevel regression with poststratification from the Behavioral Risk Factor Surveillance System, the American Community Survey, and the decennial Census [1]. Two places with identical underlying populations can register slightly different PLACES values because of the modeling step. CDC publishes margin-of-error estimates with the data; outlier flags are surfaced on the place page when applicable.
The DALY framework is not neutral. Disability weights reflect population-averaged severity from survey respondents; they do not represent any individual’s lived experience. The choice to use country-level DALY shares (rather than state, regional, or demographic-specific DALYs) trades off precision for stability. The decision is documented and the input data is the same data used by federal and international agencies.
The CHNI is not predictive of any individual. The measures are place-level prevalence estimates among adults. Two residents of the same place can have wildly different individual health profiles. The index speaks to community-level need, not personal risk.
Some measures have weaker evidence than others. Access-barrier mortality effects are best documented for uninsurance, food insecurity, and loneliness. The evidence base is thinner for utility shut-offs, transportation gaps, and SNAP receipt. These measures are included because they capture real structural constraints on care; their weights are set conservatively to reflect the lower confidence in the magnitude of the effect.
Causation is not implied. A high CHNI value documents measured need. It does not assign blame to residents, providers, employers, or policy. The page does not explain why a place has the burden it does unless a named primary source supports the explanation.
Nothing on the page is medical advice. The CHNI is descriptive of a place. It does not tell any reader what to do about their own health, medication, screening schedule, insurance, or provider.
Update cadence
The CHNI rebuilds each time CDC PLACES publishes a new annual release (typically once per year). The release year used for each computation is stamped on every page. The methodology version, weight files, and source list are tracked in the project’s scoring directory and republished with each release. Weight changes are version-flagged so historical comparisons reference the methodology in effect at the time of publication.
References
- Centers for Disease Control and Prevention. PLACES: Local Data for Better Health, 2025 Release. Methodology and documentation. https://www.cdc.gov/places/
- Centers for Disease Control and Prevention / Agency for Toxic Substances and Disease Registry. Social Vulnerability Index. https://www.atsdr.cdc.gov/place-health/php/svi/index.html
- Health Resources and Services Administration. Area Deprivation Index. University of Wisconsin Neighborhood Atlas. https://www.neighborhoodatlas.medicine.wisc.edu/
- World Health Organization. Disability-Adjusted Life Years (DALYs): Indicator Metadata Registry. https://www.who.int/data/gho/indicator-metadata-registry/imr-details/158
- GBD 2021 Diseases and Injuries Collaborators. Global incidence, prevalence, years lived with disability (YLDs), disability-adjusted life-years (DALYs), and healthy life expectancy (HALE) for 371 diseases and injuries in 204 countries and territories and 811 subnational locations, 1990 to 2021: a systematic analysis for the Global Burden of Disease Study 2021. The Lancet 2024;403(10440):2133 to 2161. https://www.thelancet.com/journals/lancet/article/PIIS0140-6736(24)00757-8/fulltext
- GBD 2021 US Burden of Disease Collaborators. The burden of diseases, injuries, and risk factors by state in the USA, 1990 to 2021: a systematic analysis for the Global Burden of Disease Study 2021. The Lancet 2024 Dec 7;404(10469):2314 to 2340. PMID 39645376. https://pubmed.ncbi.nlm.nih.gov/39645376/
- DeSalvo KB, Bloser N, Reynolds K, He J, Muntner P. Mortality prediction with a single general self-rated health question: a meta-analysis. Journal of General Internal Medicine 2006;21(3):267 to 275. https://pubmed.ncbi.nlm.nih.gov/16336622/
- Institute for Health Metrics and Evaluation. GBD Results Tool. https://vizhub.healthdata.org/gbd-results/
- Salomon JA, Haagsma JA, Davis A, et al. Disability weights for the Global Burden of Disease 2013 study. The Lancet Global Health 2015;3(11):e712 to e723. https://www.thelancet.com/journals/langlo/article/PIIS2214-109X(15)00069-8/fulltext
- GBD 2021 Risk Factors Collaborators. Global burden and strength of evidence for 88 risk factors in 204 countries and 811 subnational locations, 1990 to 2021: a systematic analysis for the Global Burden of Disease Study 2021. The Lancet 2024;403(10440):2162 to 2203. https://www.thelancet.com/journals/lancet/article/PIIS0140-6736(24)00933-4/fulltext
- Centers for Disease Control and Prevention. Tobacco-Related Mortality Fact Sheet. https://archive.cdc.gov/www_cdc_gov/tobacco/data_statistics/fact_sheets/health_effects/tobacco_related_mortality/index.htm
- Tindle HA, Newhouse PA, Freiberg MS, et al. New Estimates of Smoking-Attributable Mortality in the U.S. From 2020 Through 2035. American Journal of Preventive Medicine 2024. https://pubmed.ncbi.nlm.nih.gov/38143046/
- Esser MB, Sherk A, Liu Y, Naimi TS. Deaths from Excessive Alcohol Use — United States, 2016 to 2021. MMWR Morbidity and Mortality Weekly Report 2024;73(8):154 to 161. https://www.cdc.gov/mmwr/volumes/73/wr/mm7308a1.htm
- Carlson SA, Adams EK, Yang Z, Fulton JE. Percentage of Deaths Associated With Inadequate Physical Activity in the United States. Preventing Chronic Disease 2018;15:170354. https://www.cdc.gov/pcd/issues/2018/17_0354.htm
- Itani O, Jike M, Watanabe N, Kaneita Y. Short sleep duration and health outcomes: a systematic review, meta-analysis, and meta-regression. Sleep Medicine 2017;32:246 to 256. https://pubmed.ncbi.nlm.nih.gov/27743803/
- Institute of Medicine, Committee on the Consequences of Uninsurance. Care Without Coverage: Too Little, Too Late. Washington, DC: National Academies Press; 2002. https://www.ncbi.nlm.nih.gov/books/NBK220638/
- Wilper AP, Woolhandler S, Lasser KE, McCormick D, Bor DH, Himmelstein DU. Health Insurance and Mortality in US Adults. American Journal of Public Health 2009;99(12):2289 to 2295. https://pmc.ncbi.nlm.nih.gov/articles/PMC2775760/
- Sommers BD, Baicker K, Epstein AM. Mortality and Access to Care among Adults after State Medicaid Expansions. New England Journal of Medicine 2012;367:1025 to 1034. https://www.nejm.org/doi/full/10.1056/NEJMsa1202099
- Miller S, Wherry LR. Health and access to care during the first 2 years of the ACA Medicaid expansions. New England Journal of Medicine 2017;376:947 to 956. https://www.nejm.org/doi/full/10.1056/NEJMsa1612890
- Ma H, Wang X, Li X, et al. Food Insecurity and Premature Mortality and Life Expectancy in the US. JAMA Internal Medicine 2024;184(3):301 to 309. https://pmc.ncbi.nlm.nih.gov/articles/PMC10825785/
- Roncarati JS, Baggett TP, O’Connell JJ, et al. Mortality Among Unsheltered Homeless Adults in Boston, Massachusetts, 2000 to 2009. JAMA Internal Medicine 2018;178(9):1242 to 1248. https://pmc.ncbi.nlm.nih.gov/articles/PMC6142967/
- National Academies of Sciences, Engineering, and Medicine. Permanent Supportive Housing: Evaluating the Evidence for Improving Health Outcomes Among People Experiencing Chronic Homelessness. Washington, DC: National Academies Press; 2018. https://nap.nationalacademies.org/catalog/25133/permanent-supportive-housing-evaluating-the-evidence-for-improving-health-outcomes
- US Preventive Services Task Force. Screening for Colorectal Cancer: US Preventive Services Task Force Recommendation Statement. JAMA 2021;325(19):1965 to 1977. https://www.uspreventiveservicestaskforce.org/uspstf/recommendation/colorectal-cancer-screening
- Bretthauer M, Løberg M, Wieszczy P, et al. Effect of Colonoscopy Screening on Risks of Colorectal Cancer and Related Death (NordICC). New England Journal of Medicine 2022;387:1547 to 1556. https://www.nejm.org/doi/full/10.1056/NEJMoa2208375
- Centers for Disease Control and Prevention. Vital Signs: Colorectal Cancer Screening, Incidence, and Mortality — United States. MMWR. https://www.cdc.gov/mmwr/preview/mmwrhtml/mm6026a4.htm
- Independent UK Panel on Breast Cancer Screening. The benefits and harms of breast cancer screening: an independent review. The Lancet 2012;380(9855):1778 to 1786. https://www.nature.com/articles/bjc2013177
- US Preventive Services Task Force. Screening for Breast Cancer: Recommendation Statement. https://www.uspreventiveservicestaskforce.org/uspstf/recommendation/breast-cancer-screening
- Krogsbøll LT, Jørgensen KJ, Gøtzsche PC. General health checks in adults for reducing morbidity and mortality from disease. Cochrane Database of Systematic Reviews 2019;Issue 1:CD009009. https://www.cochranelibrary.com/cdsr/doi/10.1002/14651858.CD009009.pub3/full
- SPRINT Research Group. A Randomized Trial of Intensive versus Standard Blood-Pressure Control. New England Journal of Medicine 2015;373:2103 to 2116. https://www.nejm.org/doi/full/10.1056/NEJMoa1511939
- Martin SS, Aday AW, Almarzooq ZI, et al. 2024 Heart Disease and Stroke Statistics: A Report of US and Global Data From the American Heart Association. Circulation 2024;149:e347 to e913. https://www.ahajournals.org/doi/10.1161/CIR.0000000000001209
- Sanz M, Marco del Castillo A, Jepsen S, et al. Periodontitis and cardiovascular diseases: Consensus report. Journal of Clinical Periodontology 2020;47(3):268 to 288. https://onlinelibrary.wiley.com/doi/10.1111/jcpe.13189
- Holt-Lunstad J, Smith TB, Baker M, Harris T, Stephenson D. Loneliness and Social Isolation as Risk Factors for Mortality: A Meta-Analytic Review. Perspectives on Psychological Science 2015;10(2):227 to 237. https://journals.sagepub.com/doi/full/10.1177/1745691614568352
- Office of the U.S. Surgeon General. Our Epidemic of Loneliness and Isolation: The U.S. Surgeon General’s Advisory on the Healing Effects of Social Connection and Community. Washington, DC: U.S. Department of Health and Human Services; 2023. https://www.hhs.gov/sites/default/files/surgeon-general-social-connection-advisory.pdf
- U.S. Department of Agriculture, Economic Research Service. Food Security in the U.S. and the Adult Food Security Survey Module. https://www.ers.usda.gov/topics/food-nutrition-assistance/food-security-in-the-u-s/
- Centers for Disease Control and Prevention, National Center for Health Statistics. Heat-Related and Cold-Related Deaths in the United States. https://www.cdc.gov/nchs/data/databriefs/db481.htm
- Wolfe MK, McDonald NC, Holmes GM. Transportation Barriers to Health Care in the United States: Findings From the National Health Interview Survey, 1997 to 2017. American Journal of Public Health 2020;110(6):815 to 822. https://pmc.ncbi.nlm.nih.gov/articles/PMC7204444/
- University of Wisconsin Population Health Institute. County Health Rankings and Roadmaps. https://www.countyhealthrankings.org/