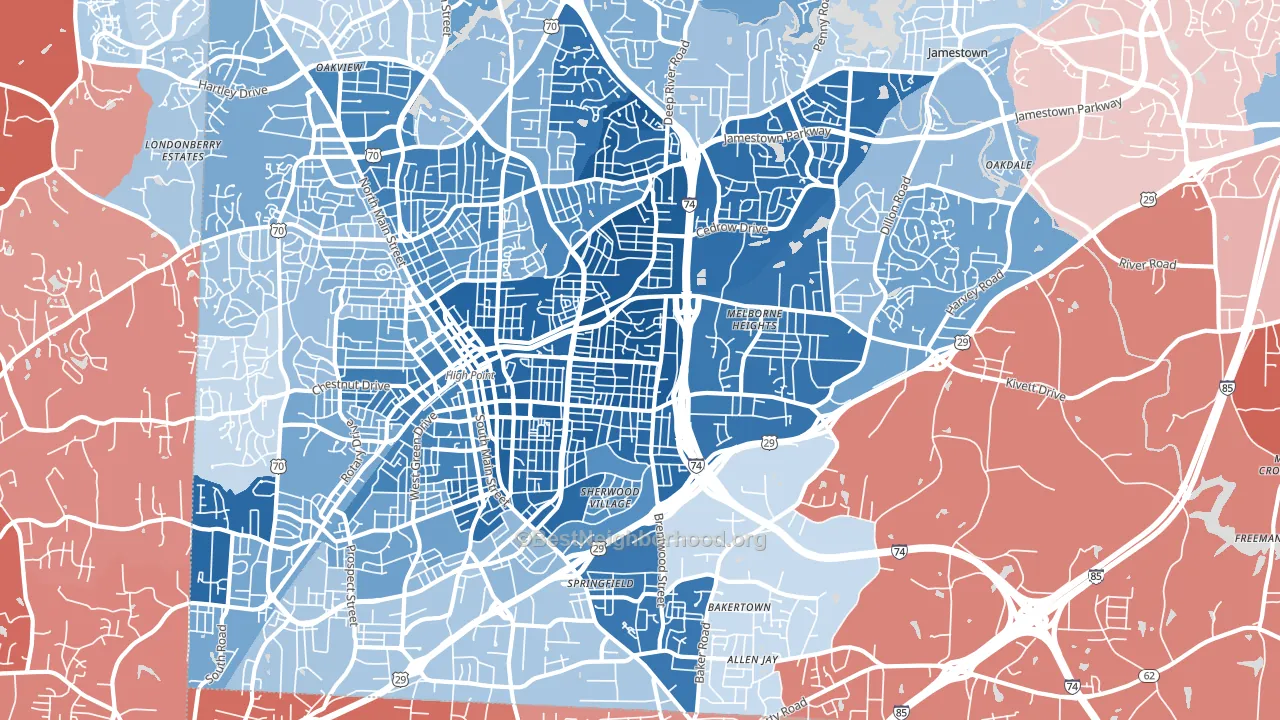
27260 is a Democratic stronghold. About 78% of voters here vote Democratic and 22% Republican.
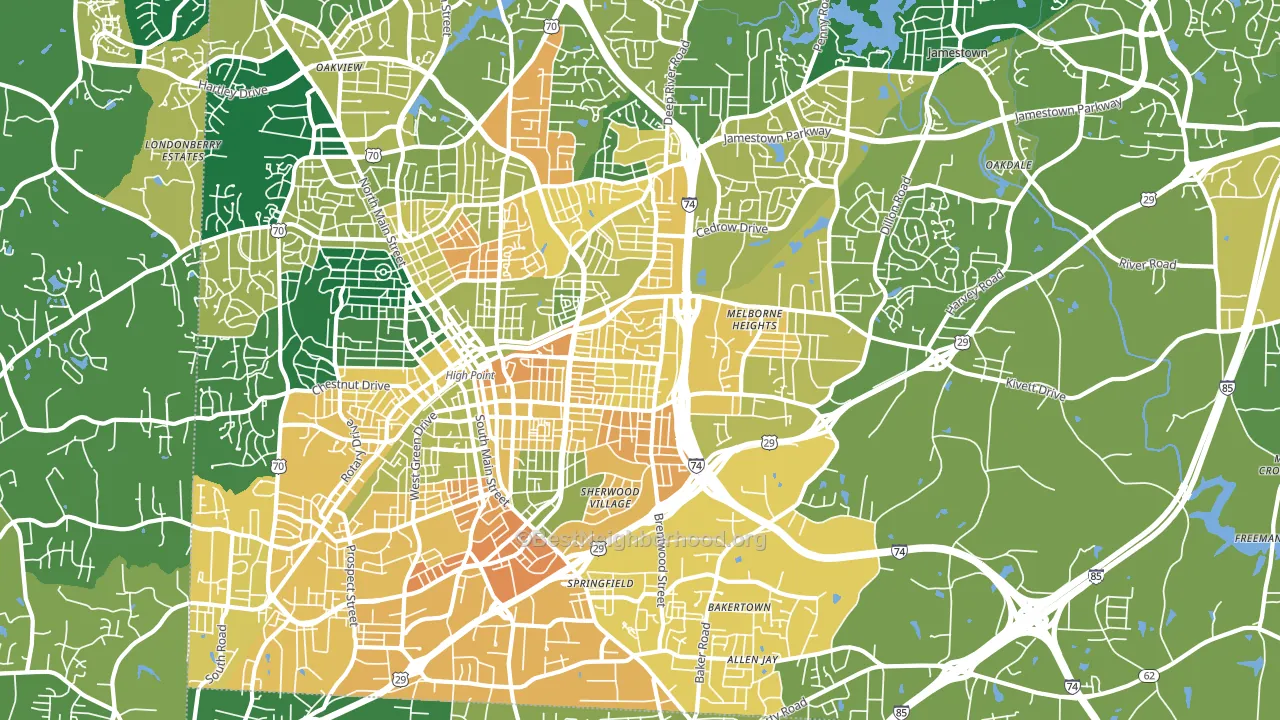
About 56% of adults in 27260 typically vote, below the U.S. average of about 62%. Among adults in 27260, ~44% vote Democratic, ~12% Republican, and ~44% don't vote. The map below shows estimated turnout by block group.
How 27260 compares
Among zip codes within 15 miles, 27260 leans more Democratic than 19 of 21 neighbors.
27260 runs about 58 points more Democratic than North Carolina as a whole. North Carolina leans Republican overall, while 27260 is one of the few Democratic-leaning pockets.
Politics vary noticeably by block within 27260. The north side is the most Democratic-leaning (D+74) and the southwest side is the least Democratic-leaning (D+24), a spread of about 49 points.
Why 27260 leans the way it does
This analysis examined 14,881 data points per zip code to find what predicts political lean and turnout. The items below are a few correlations that stood out for 27260, not a ranked or complete list of what matters most.
Density combined with diversity predicts Democratic voting. Non-Hispanic white share in 27260 is about 19%, about 53 points below the U.S. average of 72%. A high never-married share predicts Democratic voting, and about 46% of adults in 27260 have never been married, above 93% of zip codes. 27260 runs against the grain of North Carolina, a Democratic-leaning pocket in a Republican-leaning state.
High-school completion, developed land, and voter turnout
Places that combine low high-school-completion share and a heavily developed built environment tend to turn out at a lower rate, as 27260, NC does.
Why turnout in 27260 looks the way it does
Areas with limited routine healthcare access turn out at lower rates. 27260 is in the bottom quarter nationally for routine-care measures such as insurance coverage, preventive screenings, and dental visits. The dental-visit rate here is about 44%, about 16 points below the North Carolina average of 61%. Renters vote less often than owners, and about 57% of households in 27260 rent, compared to around 35% in nearby zip codes. High food insecurity lines up with lower turnout, and about 39% of adults in 27260 report food insecurity, above 98% of zip codes. Learn more about the findings and methodology on the political spectrum map.
Nearby Zip Codes
Zip Codes with Similar Populations
Sources and methodology
Precinct-level voting records used to fit the model come from North Carolina State Board of Elections, distributed by the Voting and Election Science Team. Demographic inputs come from the U.S. Census Bureau (ACS 5-year estimates and the 2020 Decennial Census). Health and environmental inputs come from the CDC (PLACES and the Environmental Justice Index). Land cover comes from the USGS and EPA. Election-day and lead-up weather come from PRISM 4km daily grids and the NOAA Global Historical Climatology Network. Mail-voting and election-administration patterns come from the MIT Election Lab's Survey of the Performance of American Elections. Block-group crime detail comes from CrimeGrade. Internet data and modeling support provided by ISPreports.org.
Modeling and analysis by the BestNeighborhood data science team. Full methodology and findings: political spectrum map.
Methodology reviewed by the BestNeighborhood data team. Last updated May 2026.