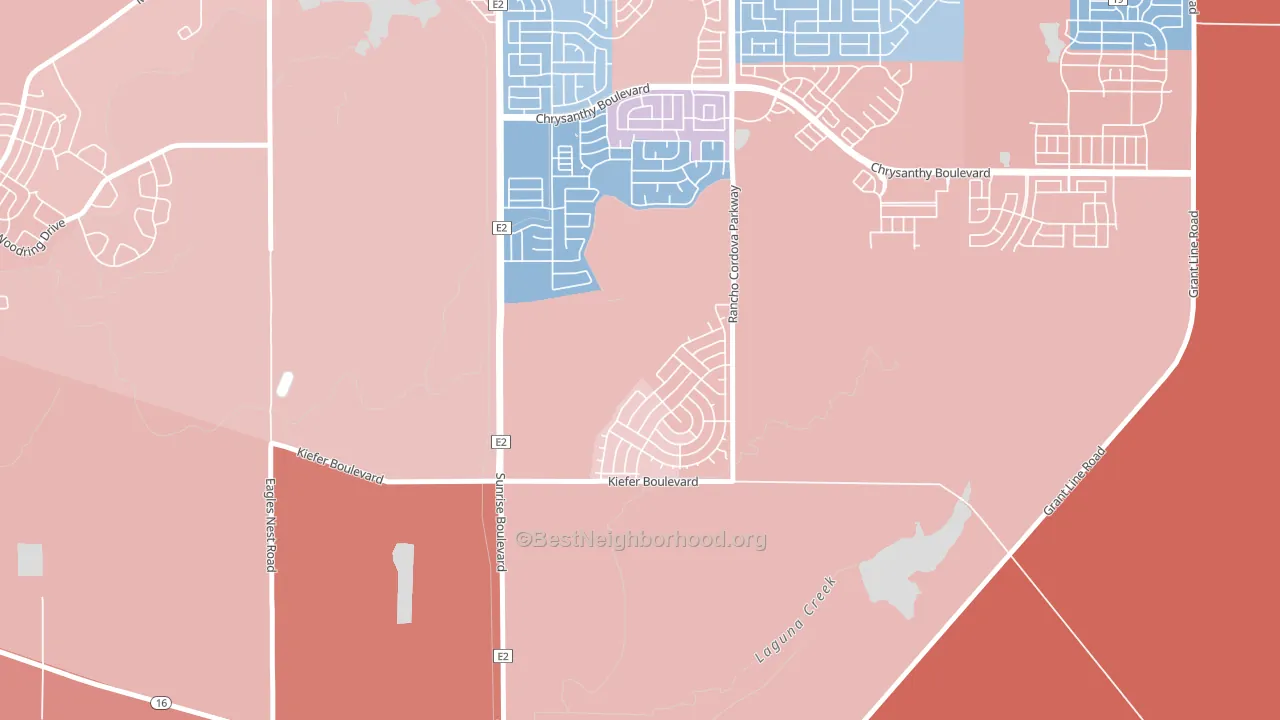
Anatolia Village leans slightly Democratic by roughly 10 points: about 55% of voters vote Democratic and 45% Republican.
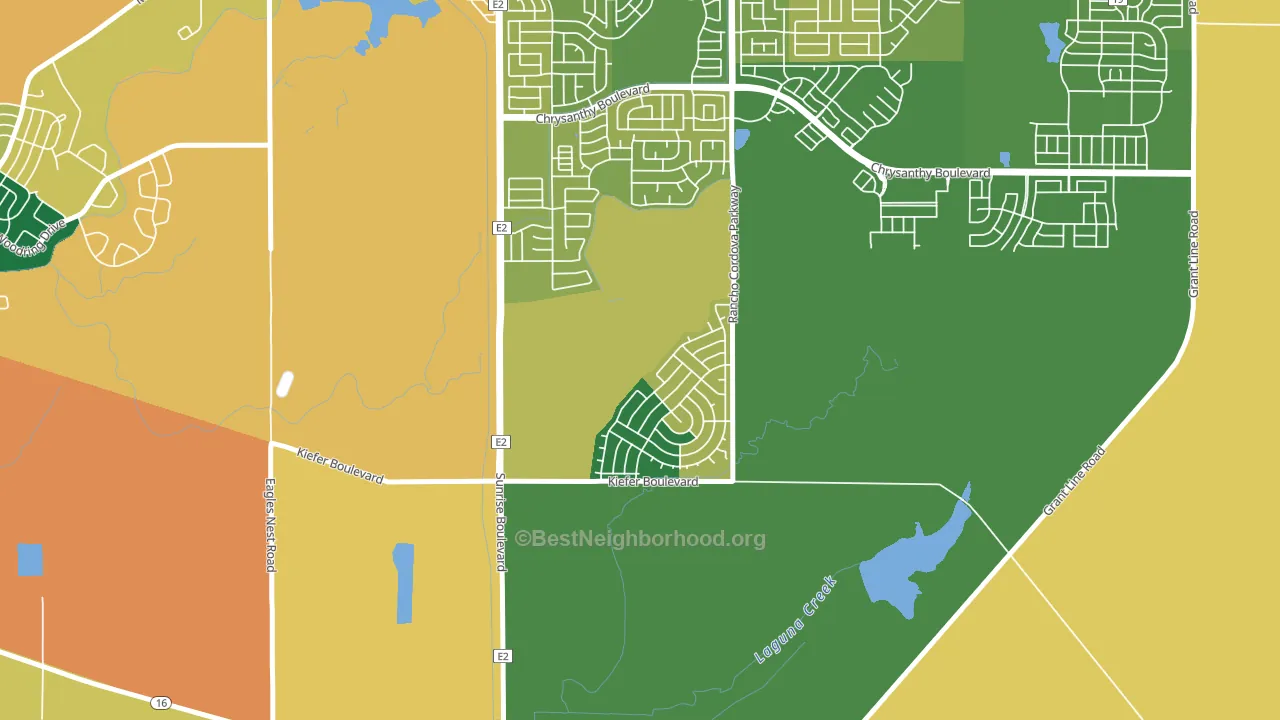
About 80% of adults in Anatolia Village typically vote, above the U.S. average of about 62%. Among adults in Anatolia Village, ~44% vote Democratic, ~36% Republican, and ~20% don't vote. The map below shows estimated turnout by block group.
How Anatolia Village compares
Anatolia Village runs about 10 points more Republican than California as a whole.
Why Anatolia Village leans the way it does
Density, race composition, education, and family structure all sit close to their national averages in Anatolia Village. The lean here lands roughly where demographic data alone would predict.
Population density, never-married share, and Democratic lean
Places that combine high population density and a low never-married share tend to lean Democratic, as Anatolia Village, Rancho Cordova, CA does.
Why turnout in Anatolia Village looks the way it does
Homeowners vote more often than renters. About 95% of households in Anatolia Village own their home, about 33 points above the California average of 62%. Learn more about the findings and methodology on the political spectrum map.
Nearby Neighborhoods
- Natomas Corporate Center, Sacramento, CA D+16
- College Glen, Sacramento, CA D+31
- Sierra Oaks, Sacramento, CA D+42
- Avondale, Sacramento, CA D+28
- Glen Elder, Sacramento, CA D+26
- Colonial Village, Sacramento, CA D+29
- Colonial Manor, Sacramento, CA D+26
- Campus Commons, Sacramento, CA D+48
- Csus, Sacramento, CA D+55
- Tahoe Park, Sacramento, CA D+54
Neighborhoods with Similar Populations
- Amtrak, San Bernardino, CA D+19
- Granite Hills, El Cajon, CA R+33
- Armory Park, Tucson, AZ D+59
- South Flagstaff, Flagstaff, AZ D+51
- Avalon, Albuquerque, NM D+17
- Southwest Quadrant, Alexandria, VA D+62
- East Augusta, Augusta, GA D+80
- Village 12, Sacramento, CA D+31
- Camelot, San Antonio, TX D+20
- Brookview, Waco, TX D+6
Sources and methodology
Precinct-level voting records used to fit the model come from California Secretary of State, Elections, distributed by the Voting and Election Science Team. Demographic inputs come from the U.S. Census Bureau (ACS 5-year estimates and the 2020 Decennial Census). Health and environmental inputs come from the CDC (PLACES and the Environmental Justice Index). Land cover comes from the USGS and EPA. Election-day and lead-up weather come from PRISM 4km daily grids and the NOAA Global Historical Climatology Network. Mail-voting and election-administration patterns come from the MIT Election Lab's Survey of the Performance of American Elections. Block-group crime detail comes from CrimeGrade. Internet data and modeling support provided by ISPreports.org.
Modeling and analysis by the BestNeighborhood data science team. Full methodology and findings: political spectrum map.
Methodology reviewed by the BestNeighborhood data team. Last updated May 2026.